360iQ’s Heatmaps feature showcases the high-traffic areas of your store or restaurant. These heatmaps reveal which parts of your location receive traffic and how much traffic they receive per period.
Content
In this guide, we will cover the proceeding topics:
How to Access Heatmaps
To access Heatmaps, take the following steps:
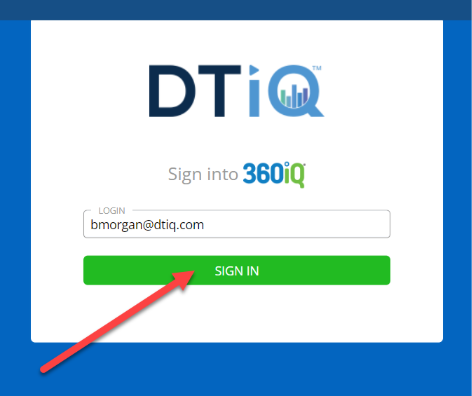
- Log in to 360iQ.
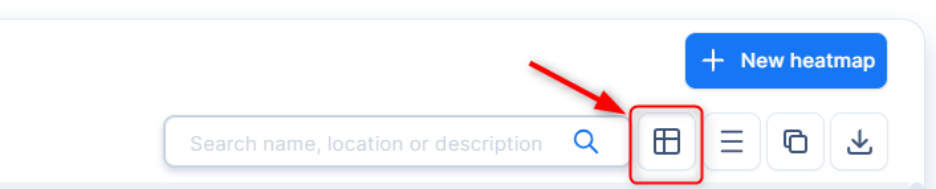
- From the Home Screen or Quick bar, find the Heatmaps tile, and click it.

- You will then be redirected to the Heatmaps Report. Here, you can view all existing heatmaps, including the following information:
- Request Name
- Location
- Created on – timestamp of when request was placed.
- Created by – author of the request.
- Start date – first day of the request.
- Ranges – number of periods of day selected.
- Cameras – number of cameras selected.
- Status of the Request
Note: You can filter table by clicking on the funnel icon in the header, or search by request name, location, and description

Additionally, you can use Column Ordering to show these options:
- End Date
- Duration
- Description
Create a New Heatmap
To create a new heatmap, proceed as follows:
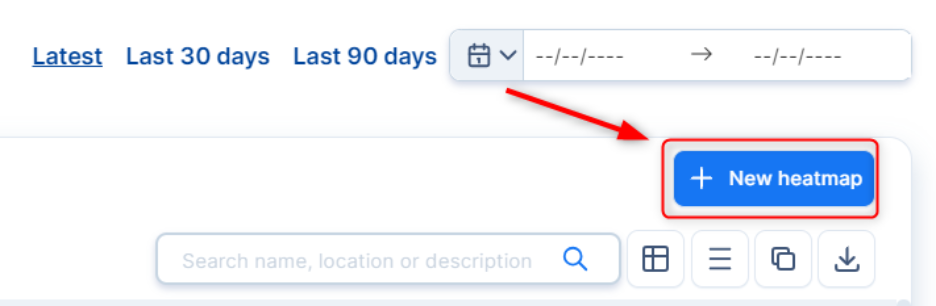
- Click the + New heatmap button in the top-right corner of the screen.
- The New heatmap request menu will open. First, select the Location from which you want to create heatmaps. You can also type the name of the Location in the Search bar. Once you have selected your preferred Location, click Next.

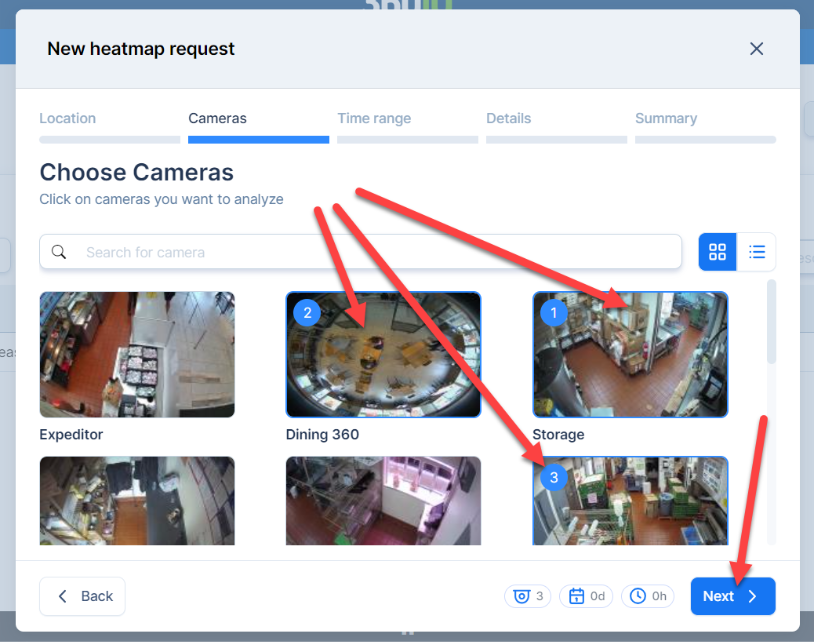
- Then, choose your Cameras. Click Next.
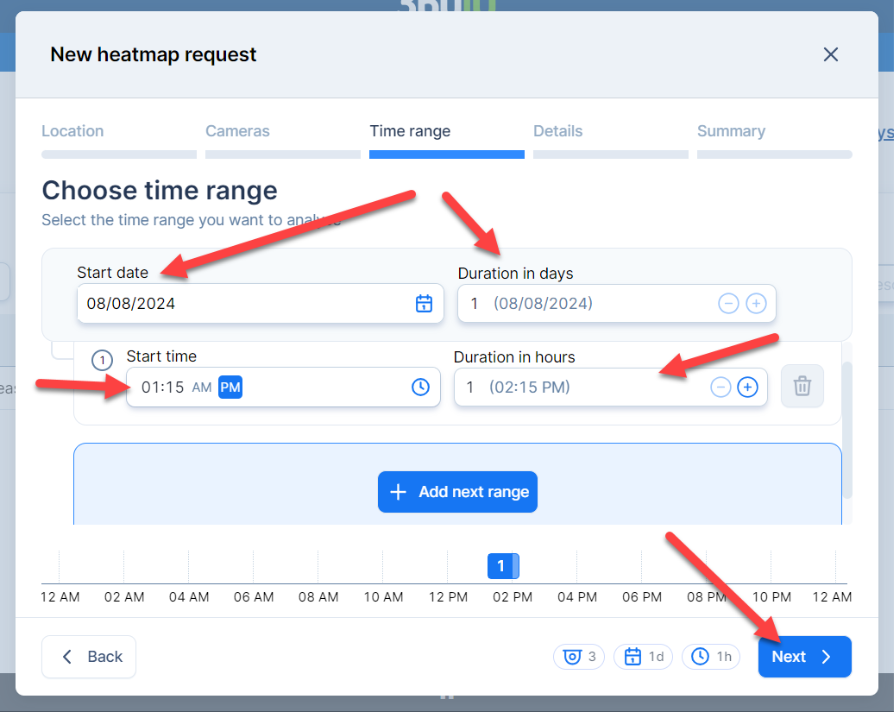
- Select your preferred Date range. Pick the Start date, Duration in days, Start time, and Duration in hours. Click Next.
- Note:
- You can adjust the duration by typing or using the -/+ buttons. Ranges cannot overlap.
- You can check how your selection aligns with the day on the timeline preview.
- A heatmap will be created from every selected camera, for each day and range. For example, if you select 4 cameras from 08/16 to 08/18 and from 8:15-10:15 am, 2:00-8:00 pm, you will create 16 images. Each heatmap request is limited to a maximum of 4 cameras and 8 hours in duration.
- Note:
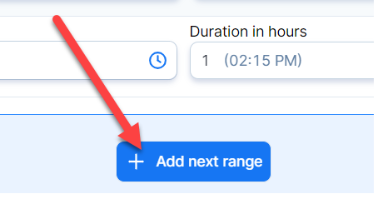
Note: To add multiple date ranges, click the Add Next Range button.
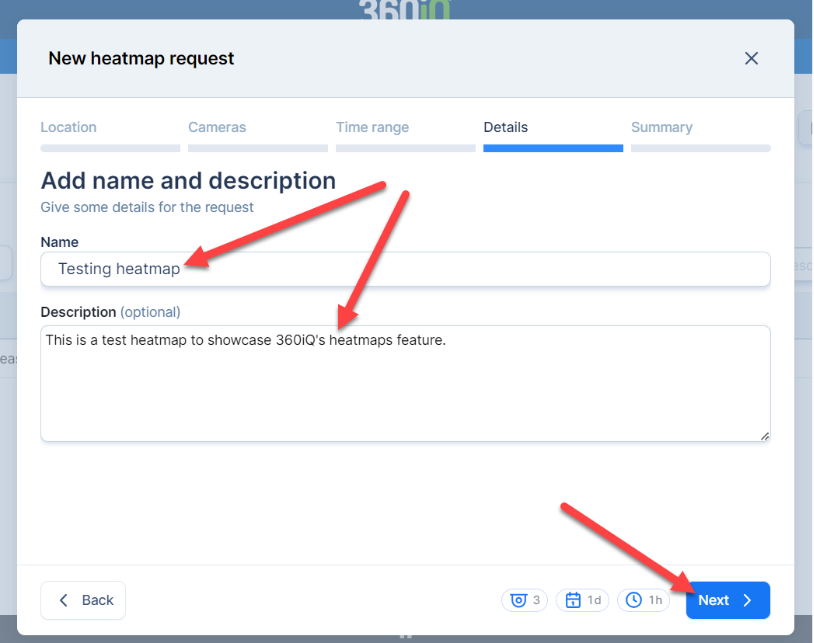
- In the last step, add the Name and the optional Description for the new heatmap. Click Next.
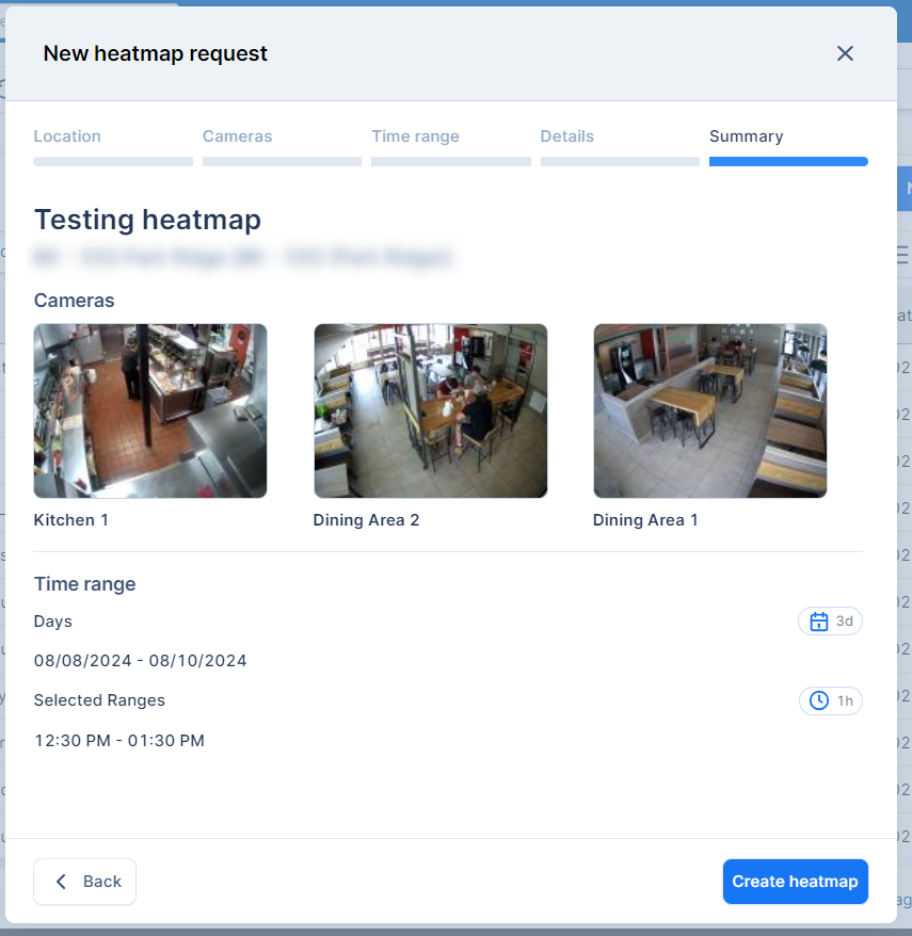
- In the Summary section, review all your information to ensure it is correct. Once everything is in order, click Create heatmap.
- You will be redirected to the Heatmaps Report. Here, you can track the Processing status of your new heatmap request.
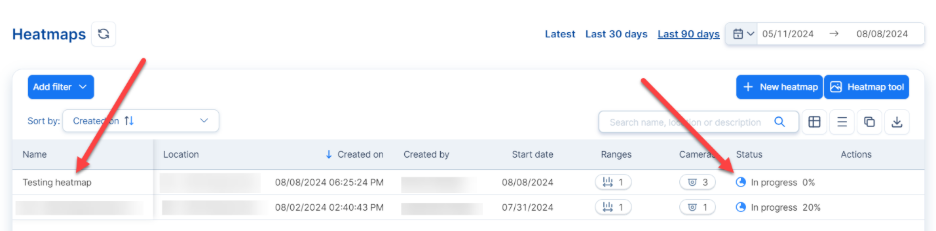
- Request statuses include:
- In Progress – request is being processed.
- Completed – request completed successfully.
- Completed with Errors – request was completed and can be viewed, but some heatmaps may not be available.
- Error – request failed and cannot be processed. This may be due to a camera issue or the location being offline.
View and Download Heatmaps
In the Heatmaps Report, you can also view all heatmap requests. For any request, scroll to the right and click the down arrow in the Actions column to save a copy of the heatmap. The file will be downloaded to your computer as a .ZIP folder.
Once the file has been downloaded, you can share it with any relevant members of your team.
To view the downloaded heatmap, extract the .ZIP file, then double-click the new folder. Find the file you would like to view, then double-click to open the image.
Note: Files are grouped by days and day periods.
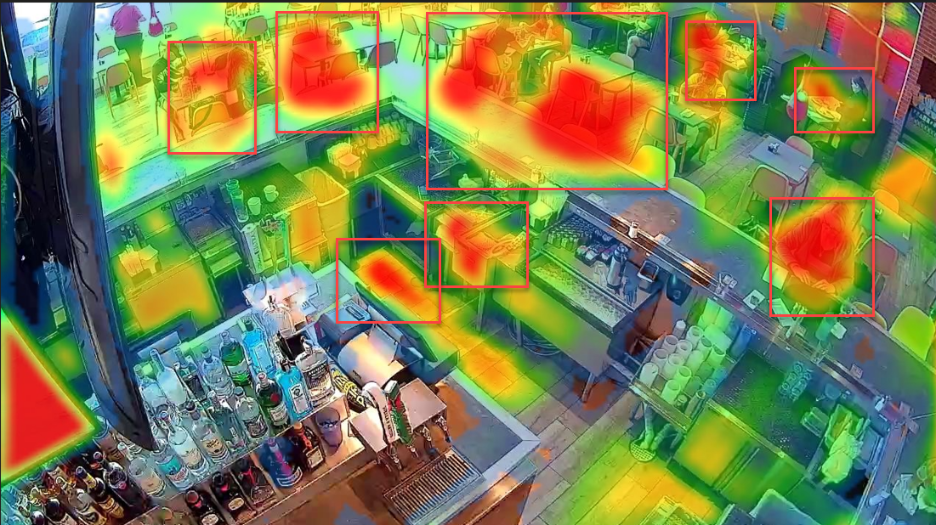
Each heatmap uses a color overlay to show how much traffic different areas receive. The color breakdown is as follows:
- No overlay – shows areas that were not occupied at all.
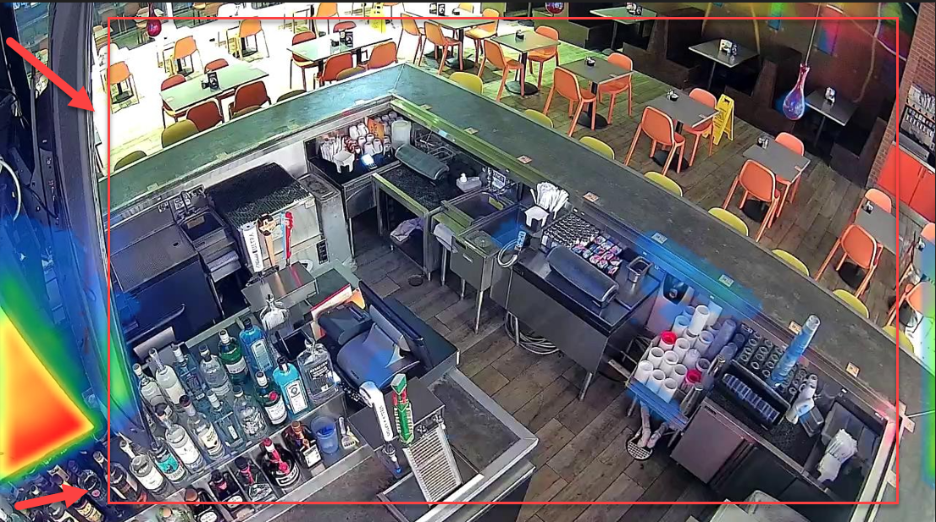
- Blue and green – show lightly occupied spaces.
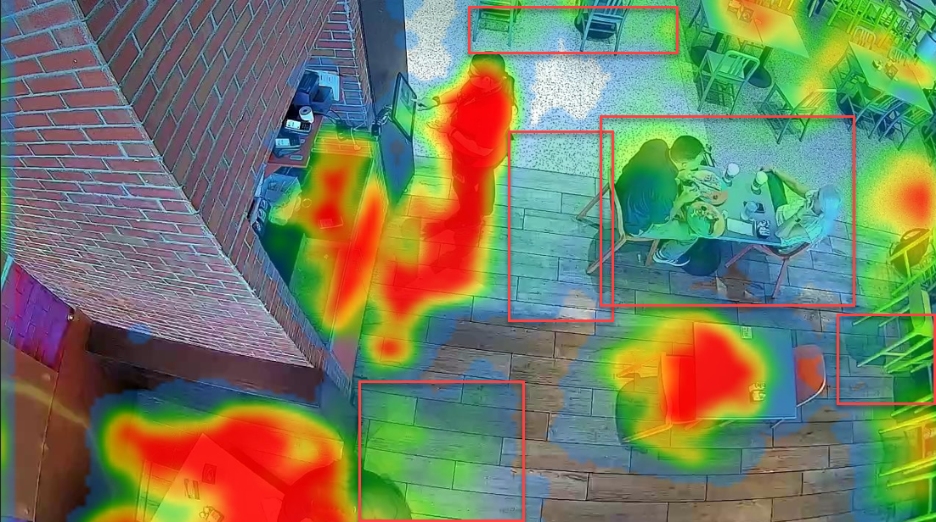
- Yellow and red – show heavily occupied areas.
For additional information or questions please contact DTiQ Support at support@dtiq.com or your Customer Experience Team at csr@dtiq.com.