A SmartAudit™ is a customizable 10-question remote audit that provides insights on how to improve your business operations. The SmartAudit™ feature requires an active subscription. Contact DTiQ Support at support@dtiq.com or your Customer Success Manager at csr@dtiq.com to learn more.
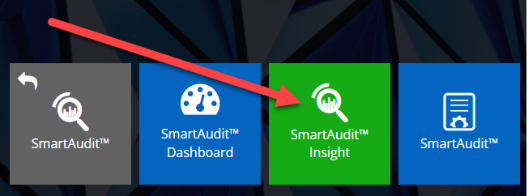
The SmartAudit™ Insight dashboard allows you to analyze operational trends affecting your business performance. To access it, click on the SmartAudit™ tile from your Home Screen, and then choose the SmartAudit™ Insight tile.

The SmartAudit™ Insight dashboard consists of 3 main sections with different levels of data aggregation.
You can access them by clicking on one of the main tabs: Overview, Location Ranking, and Audit List.

Content
In this guide, we will cover the following topics:
- Location Groups
- Date Selection
- Generate Aggregated Reports
- Generate Incident Reports
- Generate Violations Reports
To learn more about SmartAudit™ functionality, read our SmartAudit™ Insight Main Tabs guide.
Location Groups
Clicking on the Locations button takes you to the Location groups view, where you can define groups covering the selected locations. These groups let you filter data according to the range of locations defined by the group.
To create a Location group:
- Choose Locations you wish to add to the group.
- Click the SAVE GROUP button and name the group.
- Click the SAVE button and then the APPLY button.
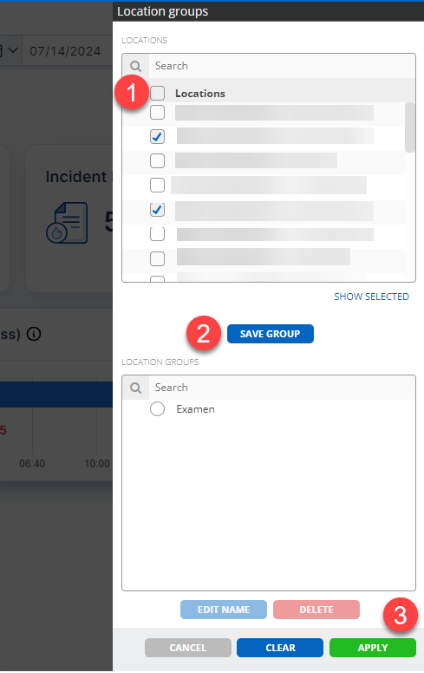
You can also edit (EDIT NAME button) or delete (DELETE button) location groups.
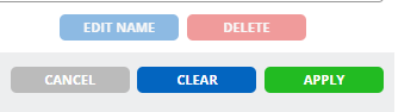
The Location groups view includes also the following buttons:
- CANCEL, which closes the current view.
- CLEAR, which removes saved filters.
- APPLY, which saves the changes.
Date Selection
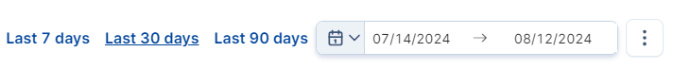
When you enter SmartAudit™ Insight, the results will be displayed for the last 30 days by default.
If you are looking for a different date range, go to the top right corner and select Last 7 days or Last 90 days, or use the custom date selector to choose a different range.
Generate Aggregated Reports
Next to the custom date selector, you will find the three dots (more) icon. To generate an aggregate report, click the more icon, then click Aggregated reports.

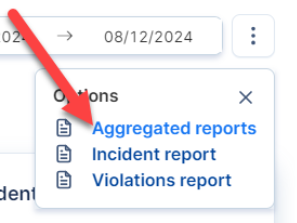
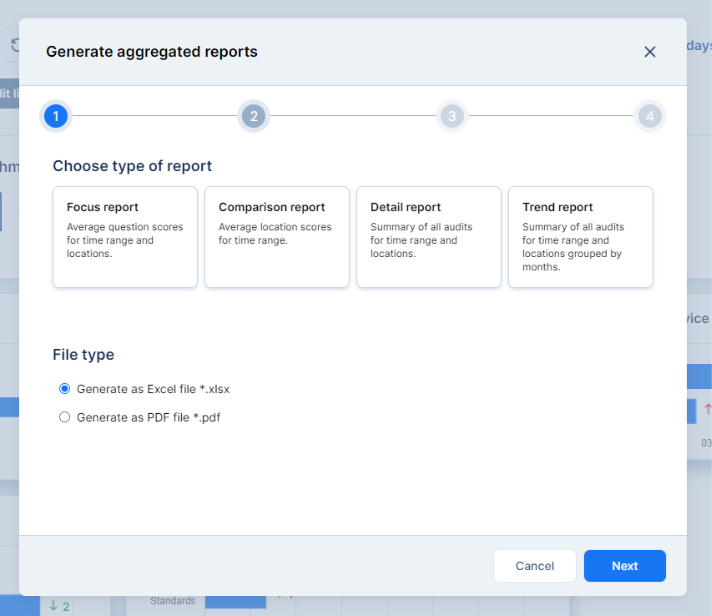
The Generate aggregated reports window will open. You can choose from various unique report options to suit your needs, including a Focus report, Comparison report, Detail report, and Trend report. When you are ready to move on, click Next.
Select your desired time range. Then, click Next.

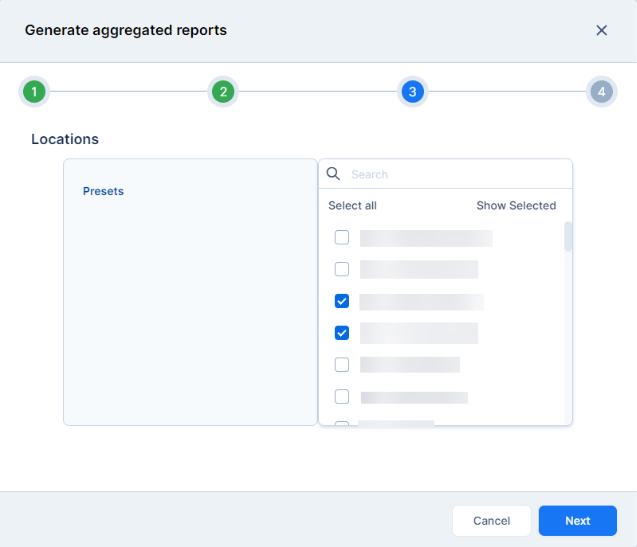
Choose your desired Locations. Click Next to move on to the final step in the report generation process.
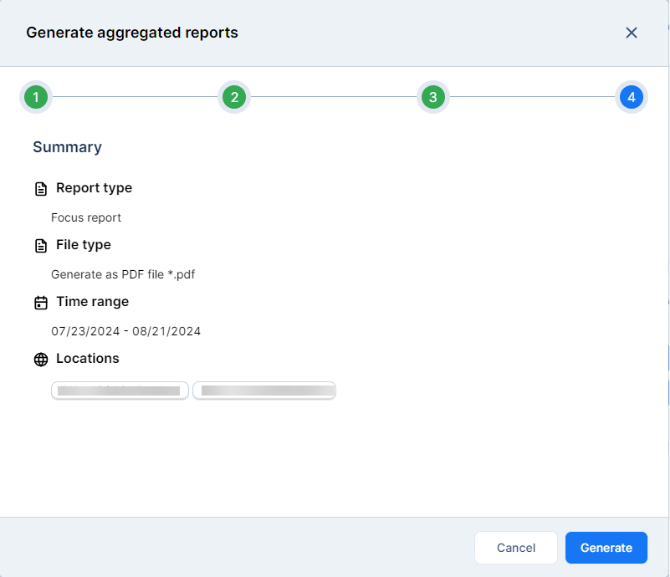
In step 4, review the Summary and make any necessary changes. Hit Generate to compile the report.
Once your aggregated report has finished processing, it will look something like this:
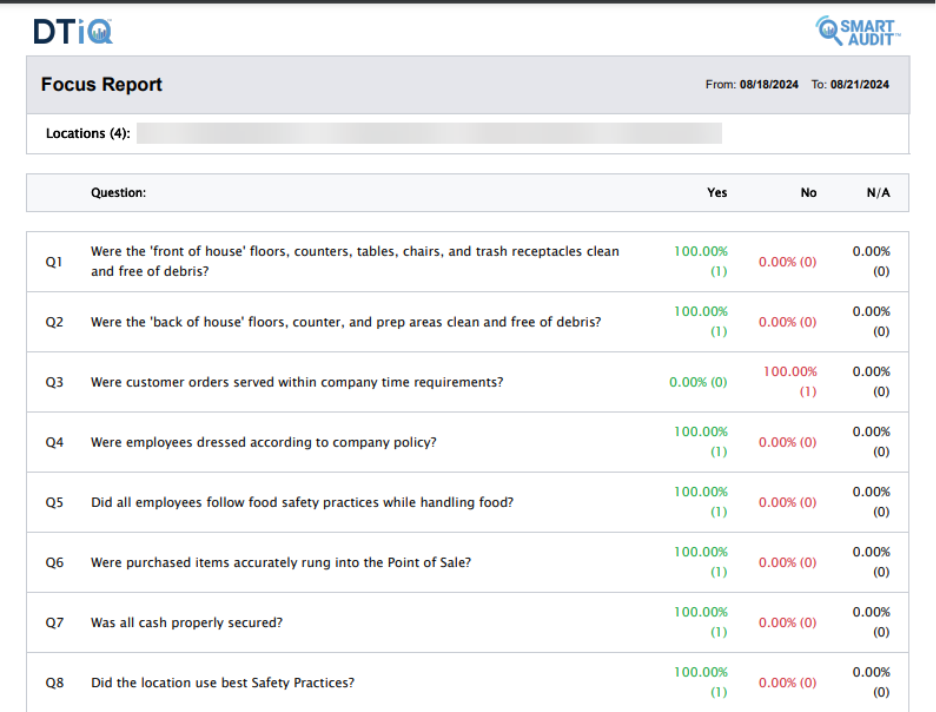
Note: All audit questions with “N/A” answers are counted in the average score and rated 0%.
Generate Incident Reports
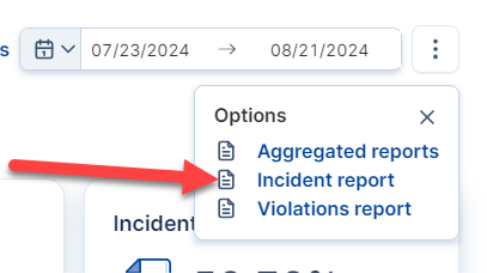
Below the Aggregated reports option, you will see an option to generate an Incident report. Click it.
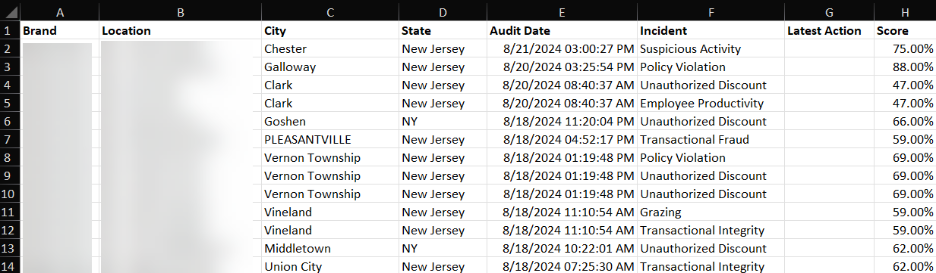
The Incident report will be downloaded to your computer as an .xlsl (Excel) file. You will most likely find it in your Downloads folder. Once opened, the report should look something like this:
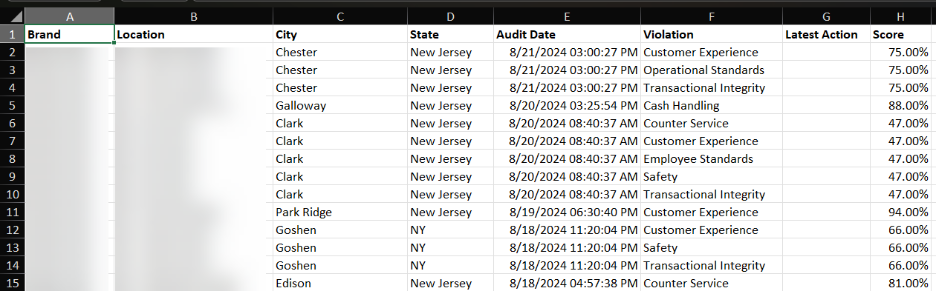
Generate Violations Reports
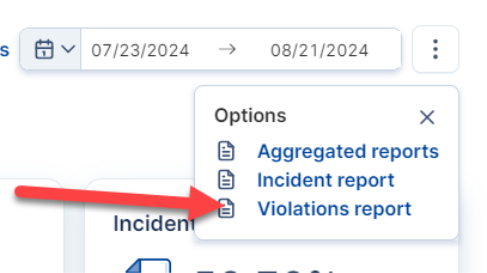
To generate a Violations report, choose it from the list of report options.
The Violations report will be downloaded to your computer as an .xlsl (Excel) file. You will most likely find it in your Downloads folder. Once opened, the report should look something like this:
For additional information or questions please contact DTiQ Support at support@dtiq.com or your Customer Experience Team at csr@dtiq.com.