DTiQ’s customizable SmartAudit™ consists of 10 questions that reveal how to improve your business operations. To use this feature, you must have an active 360iQ subscription. Contact DTiQ Support at support@dtiq.com or your Customer Success Manager at csr@dtiq.com to learn more.
Note: You can easily navigate throughout the audit by clicking on a specific question or incident.
Content
In this guide, we will cover the following topics:
To learn the basics of SmartAudit™ Insight, see our guide on the SmartAudit™ Insight Dashboard.
There are 3 main tabs for the SmartAudit™ Insight dashboard that you can select at the top of the dashboard: Overview, Location ranking, and Audit list.
1. Overview
The Overview provides insight into your overall audit question performance.
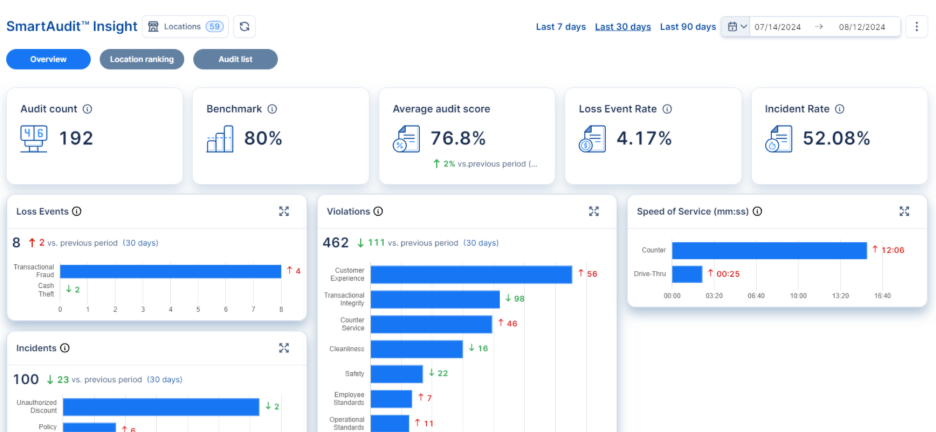
At the top of the Overview page, you can view the following information:
- Audit count—the total number of audits conducted in a given timeframe.
- Benchmark—percentage considered as a passing score.
- Average Audit Score for your locations and compare it to the previous period as well as your company benchmark (the default benchmark setting is 80% and can be changed by contacting your CSM.
- Loss Event Rate—any event where DTiQ has identified a potential financial loss.
- Incident Rate—any event where DTiQ has identified a coaching opportunity to improve performance.
Analyzing and reviewing this data helps you identify areas for improvement. For example, you can view the Average audit score for your locations and compare it to the previous period, as well as your company Benchmark.
Note: The default benchmark setting is 80% and can be changed by contacting your CSM.
Right below are charts of the number of times that Loss Events, Violations, and Incidents were found in a SmartAudit™ along with a graph of Speed of Service measurements. Click on a single bar in any of the charts to go to the Location ranking tab.
2. Location ranking
The Location Ranking is a list of locations that are sorted by SmartAudit™ scores by default.
The Opportunities/Score tab focuses on the SmartAudit™ Score and the counts for Loss Events, Incidents, and Violations. By clicking on a single row in the table, you can view the Audit list tab for more audit details for the chosen location.
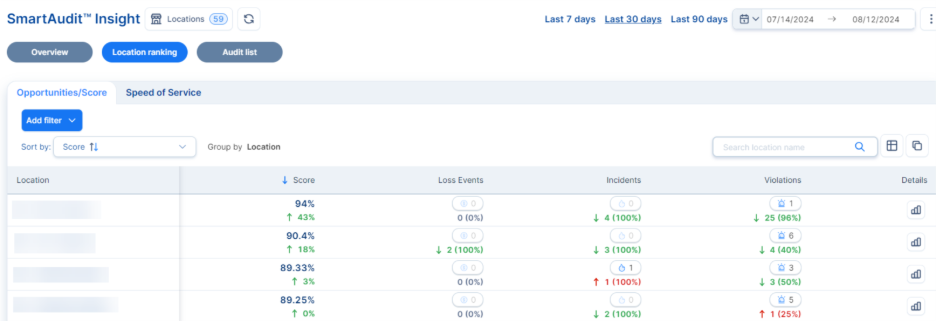

Here, you can also compare every metric with a previous period. By default, this period covers the last 30 days, but you can also adjust the time period in the top right to last 7 days or last 90 days.
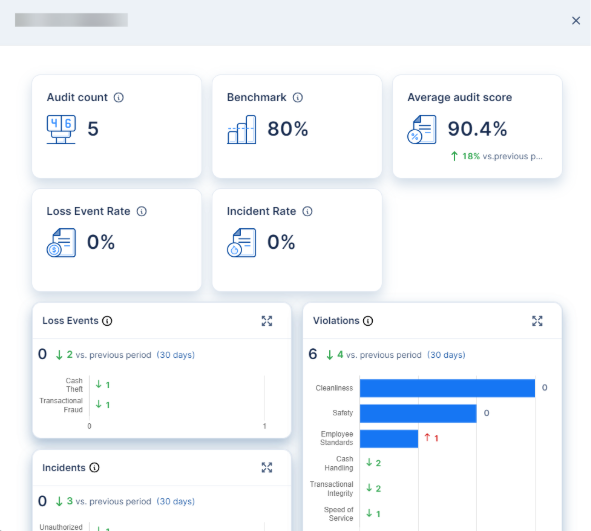
Click the chart icon to see the details of a location’s audit score and details regarding Loss Events, Incidents, and Violations.
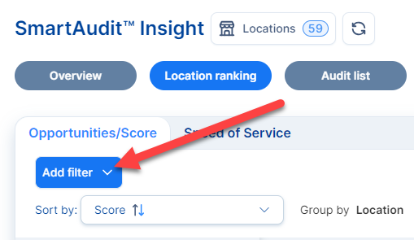
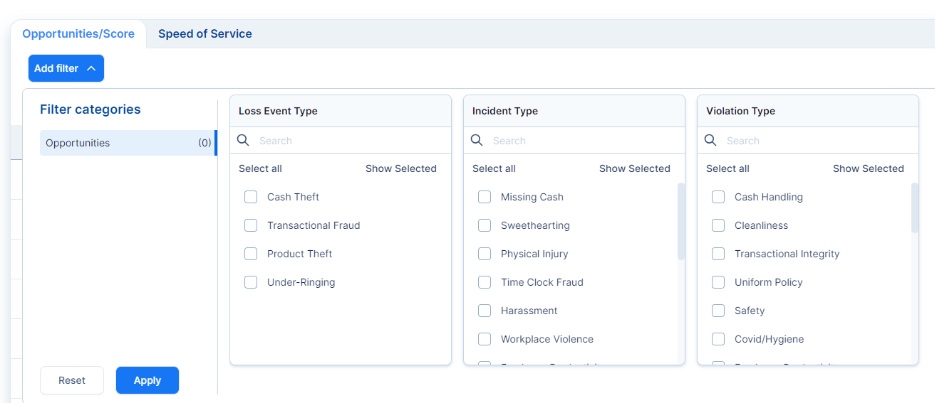
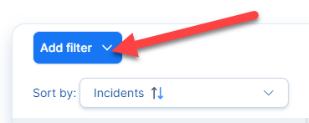
In the Location ranking tab, click the Add filter button to filter the table.
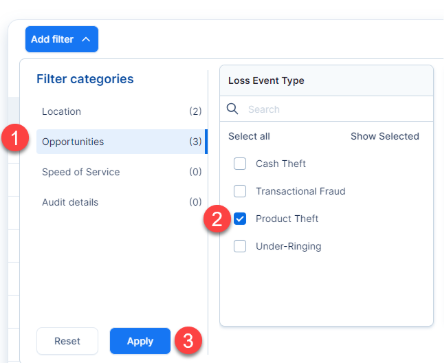
Select the items of interest from the Loss Event Type, Incident Type, and Violation Type menus. Click the Apply button to apply the selected filters. To close the panel without any changes, click the Add filter button again.
You can reset all filters by clicking the Reset button.
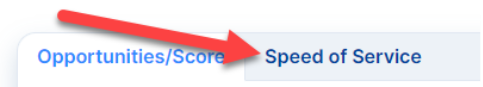
Click the Speed of Service tab to view information about the average and longest Speed of Service for a given location.
The Speed of Service type is set to Counter by default. You can change the type via the drop-down menu.

Audit List
The Audit list lets you explore the full list of audits performed for a given time range for all your locations, including information about the number of Loss Events, Incidents, and Violations, along with Speed of Service times and audit score.
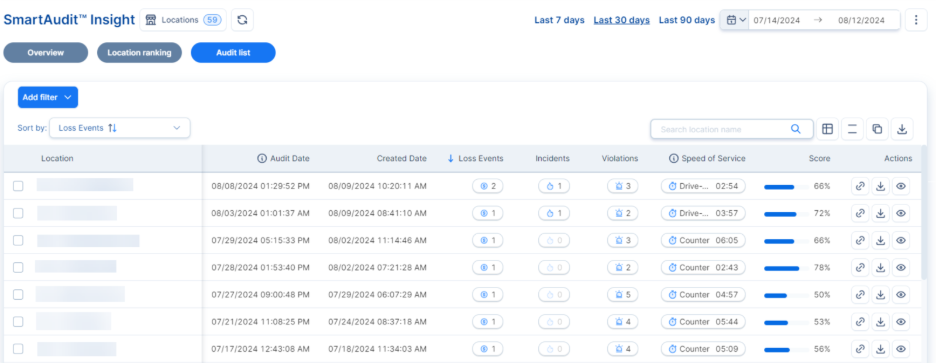
To see more details, click the icons with counts.
In the Actions column, you will see the following symbols:
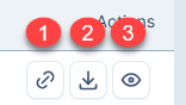
- Link—copy a link to the SmartAudit™ report.
- Download—download a PDF version of the SmartAudit™ report.
- Preview—view the SmartAudit™ report in your web browser.
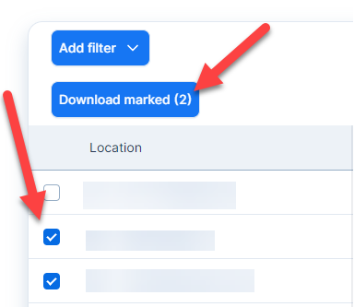
To download multiple SmartAudit™ reports, mark checkboxes on the left side. Then, click the Download marked button right above the table.
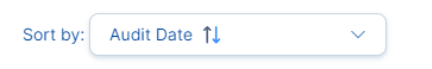
As you enter the Audit list page, audits are sorted by Audit date. To change this sorting, use the Sort by drop-down or the arrow icons in the table headers.
Filter panel
To filter the table, click the Add filter button.
Select one of the Filter categories on the left side of the screen. Next, select the specific items of interest in the menu(s) next to Filter categories. To apply the selected filters, click Apply.
Audit Report
To view a single SmartAudit™ report, click the eye icon. The report window will open.
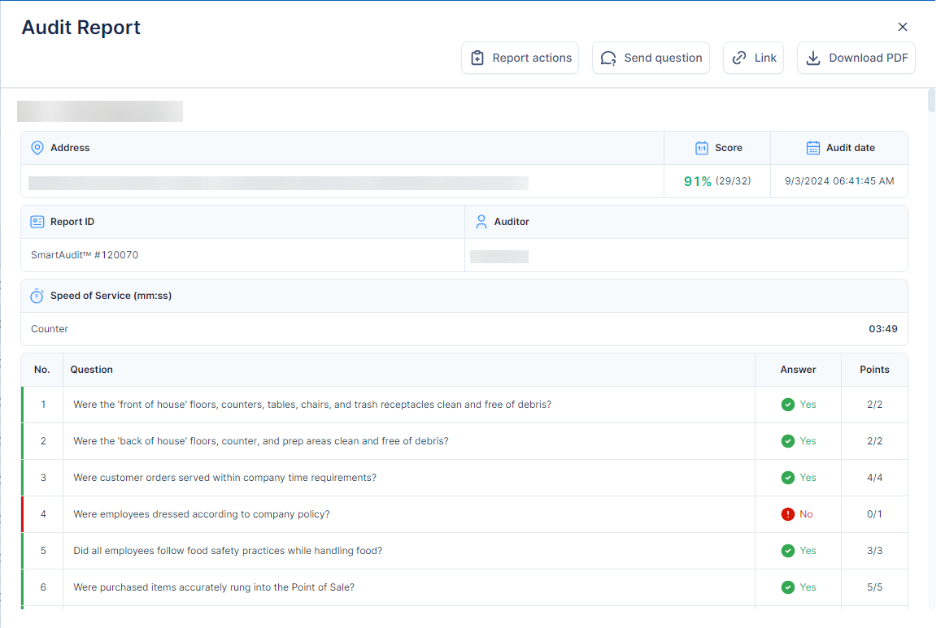
Note: All audit questions with “N/A” answers are counted in the average score and rated 0%.
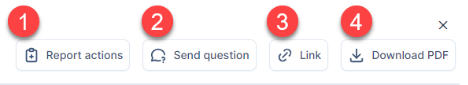
When you open a report, 4 buttons are displayed:
- Report actions—log actions you have taken based on the SmartAudit™ report.
- Send question—send any question(s) directly to auditors.
- Link—copy the report link to the clipboard.
- Download PDF—download the report as a PDF file.
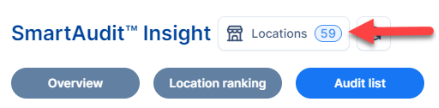
Manage Locations
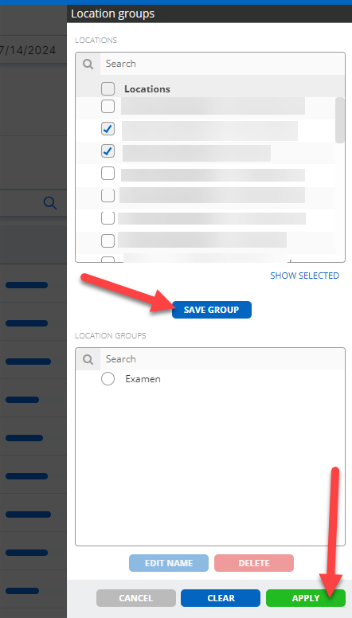
To set global filters for the dashboard, click the Locations button at the top of the screen. A menu will pop up.
From here, you can choose locations, create a location group with the selected filters, and click Apply to save your changes.
For additional information or questions please contact DTiQ Support at support@dtiq.com or your Customer Experience Team at csr@dtiq.com.