Note: DTiQ’S In-store Speed of Service (SoS) feature requires an active subscription.
Content
This comprehensive guide addresses these key points:
How to Access In-store Speed of Service
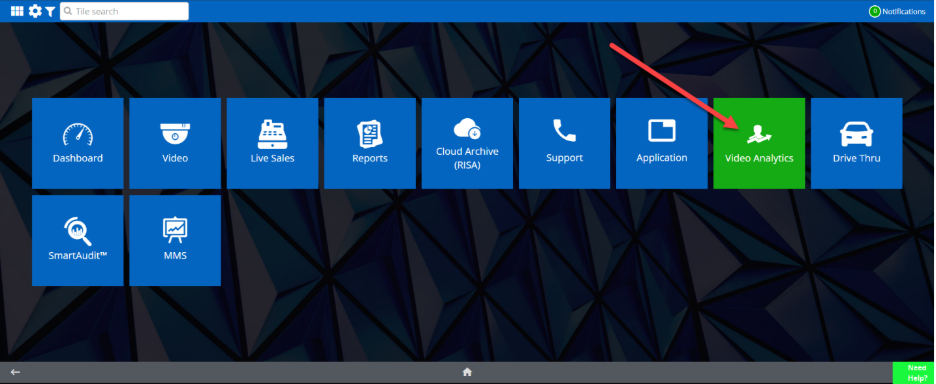
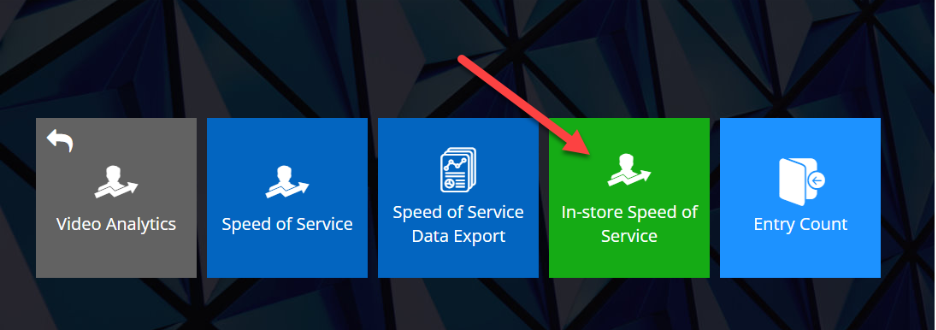
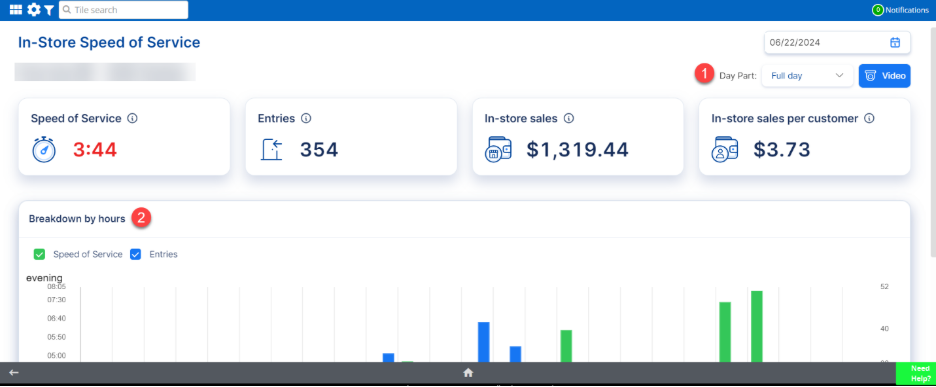
To access your In-store Speed of Service metrics, select the Video Analytics tile and then click on the In-store Speed of Service tile.
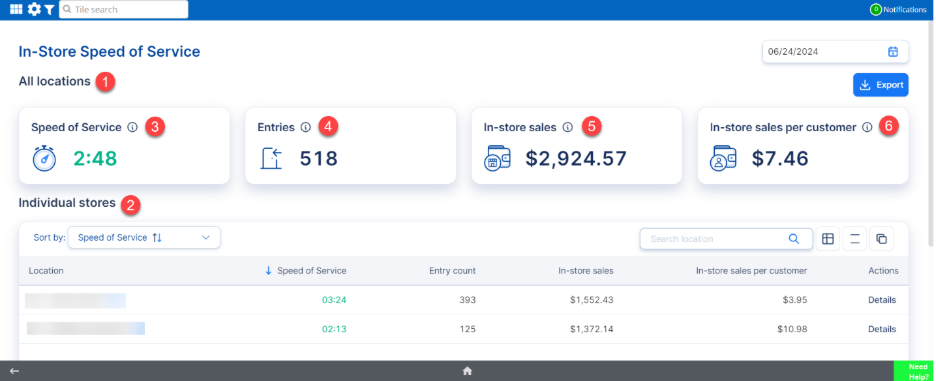
The In-store Speed of Service dashboard consists of the following aggregate metrics:
- Aggregated data for all locations
- In-store Speed of Service metrics for individual locations
- Speed of Service (mm:ss)
- Entries
- In-store sales
- In-store sales per customer
Speed of Service Breakdown
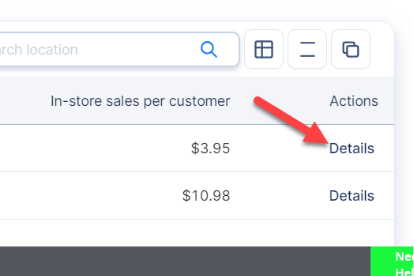
Under Individual stores, click on the Show Details button for a location to view Video for the location and to review the following drill-down data:
- Breakdown by Day Part – data available for parts of the current date that is updated throughout the day.
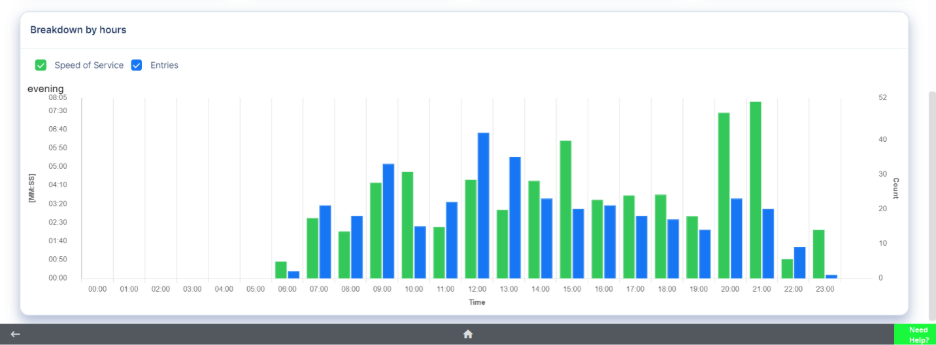
- Breakdown by hours – graph featuring two bars per hour that show speed of service and entry counts with a green line indicating the SoS target value.
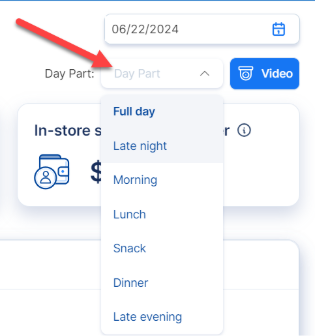
Breakdown by Day Part
To view a more thorough breakdown of In-store Speed of Service per Day Part, select your desired Day Part in the top right corner of the screen. Your options include Full day (default), Late night, Morning, Lunch, Snack, Dinner, and Late evening.
When a day part is selected, the metrics will recalculate for the date selected.
Breakdown by Hours
Much like the breakdown per Day Part, the Breakdown by hours graph provides further insight into a location’s Speed of Service metrics.
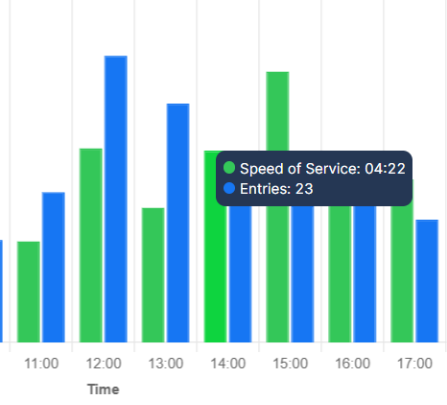
You can hover over these bars to view specific metrics for that time, including Speed of Service and total Entries.
For additional information or questions please contact DTiQ Support at support@dtiq.com or your Customer Experience Team at csr@dtiq.com.