As part of 360iQ’s comprehensive Video Analytics, the Peak Times Speed of Service feature provides insight into the busiest times at your service locations so you can pinpoint potential areas for improvement.
Content
In this guide, we will cover the proceeding topics:
- How to Access Peak Times Speed of Service
- Peak Times Speed of Service Overview
- Peak Times Speed of Service Details
How to Access Peak Times Speed of Service
To access the Peak Times Speed of Service feature, take the following steps:
- Log in to 360iQ: https://app.go360iq.com/.
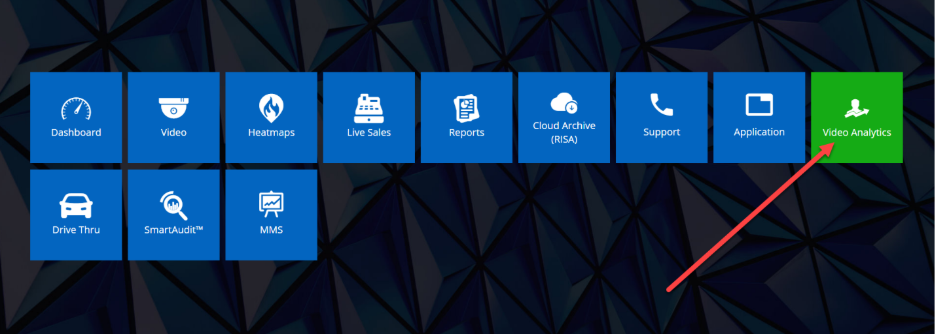
- From the Home Screen or Quick Bar, click the Video Analytics tile.
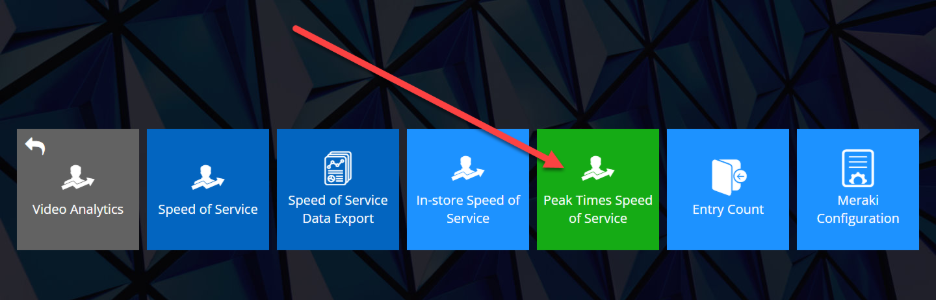
- Click the Peak Times Speed of Service tile.
Peak Times Speed of Service Overview
When you first enter Peak Times Speed of Service, you will be redirected to the Overview page.
The breakdown is as follows:
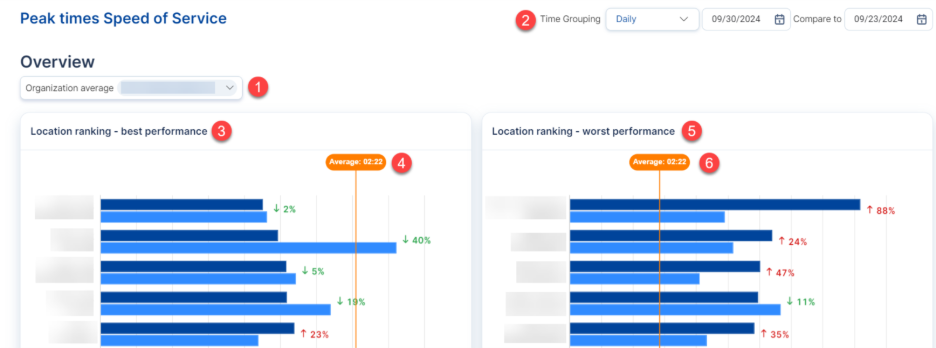
- Organization average: At the top of the page, under the Overview heading, you will see the name of your selected organization next to Organization average.
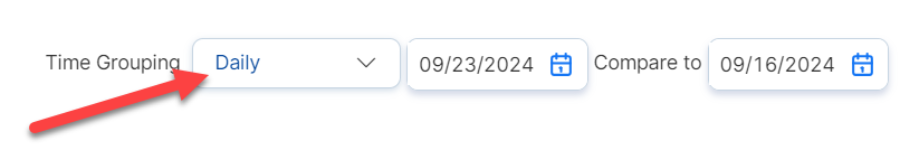
- Time Grouping: In the top-right corner of the screen, you will see the Time Grouping. Changing this grouping will change the performance rankings below.
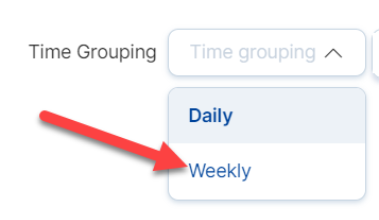
- Note: By default, the Time Grouping will be Daily. You can easily change it to Weekly by selecting the option in the dropdown menu.
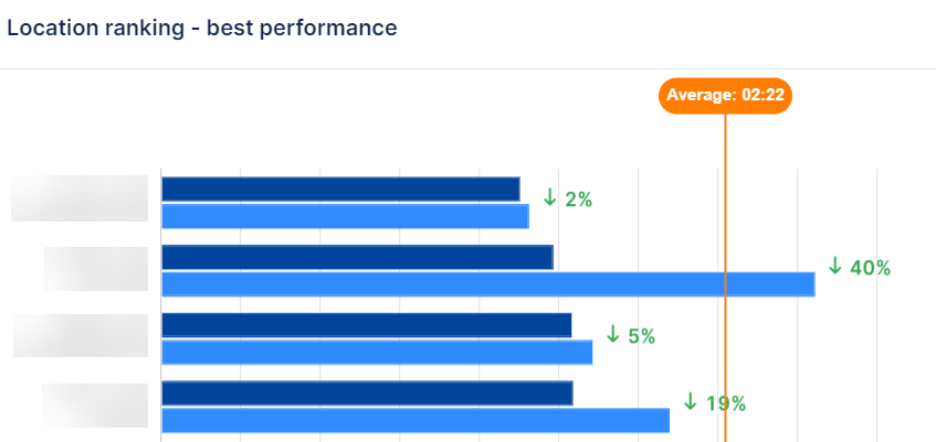
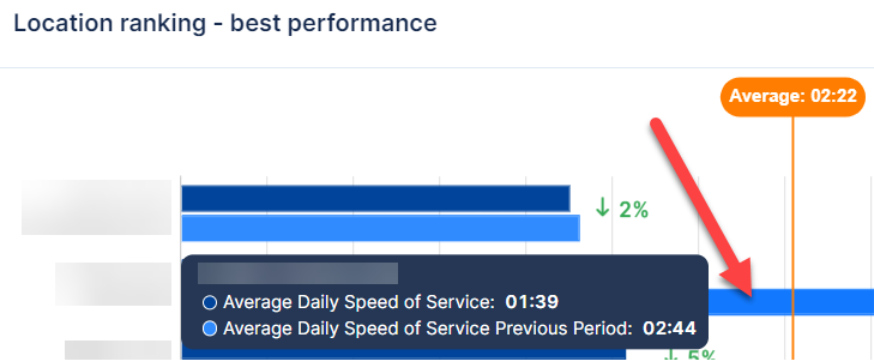
- Location ranking – best performance: Immediately underneath the Overview section, you will see your top Location in terms of best performance.
- Best performance Average: To the right of the graph, you will see the Average Speed of Service time in minutes and seconds via the orange callout.
- Hover over the bars in the graph to view the Average Daily Speed of Service and the Average Daily Speed of Service Previous Period.
- Note: If you change the Time Grouping via the dropdown, the hover options here will also change (for example, Daily to Weekly).
- To the left of the orange callout, you will see the average rate of change as a percent increase/decrease (compared to the previous period). Increases in service time will appear red with an up arrow beside them, whereas decreases in service time will appear green with a down arrow beside them.
- Hover over the bars in the graph to view the Average Daily Speed of Service and the Average Daily Speed of Service Previous Period.
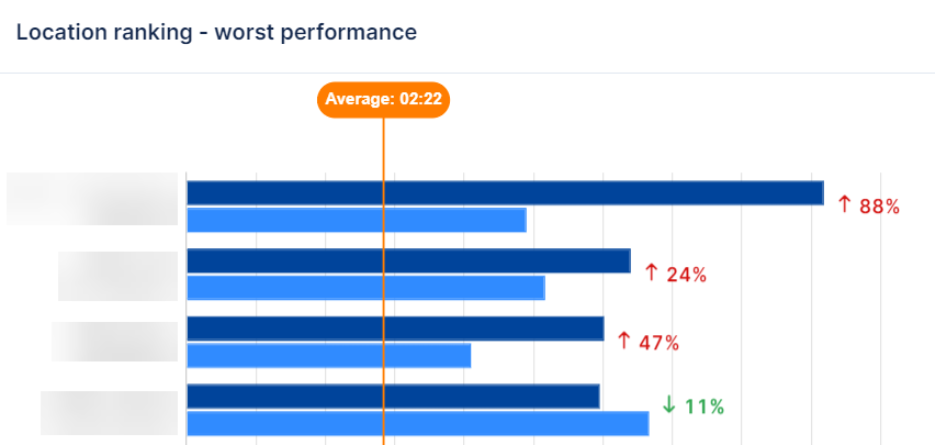
- Location ranking – worst performance: To the right of Location ranking – best performance is Location ranking – worst performance, which shows you your worst-performing location (in other words, the location with the highest Speed of Service).
- Worst performance Average: To the right of the graph, you will see the Average Speed of Service time in minutes and seconds via the orange callout.
- Hover over the bars in the graph to view the Average Daily Speed of Service and the Average Daily Speed of Service Previous Period.
- Note: If you change the Time Grouping via the dropdown, the hover options here will also change (for example, Daily to Weekly).
- To the right of the orange callout, you will see the average rate of change as a percent increase/decrease (compared to the previous period). Increases in service time will appear red with an up arrow beside them, whereas decreases in service time will appear green with a down arrow beside them.
- Hover over the bars in the graph to view the Average Daily Speed of Service and the Average Daily Speed of Service Previous Period.
Peak Times Speed of Service Details
To drill down into the Peak Times Speed of Service Details, simply click into the location via the bar graph.
You will be redirected to the Peak Times Speed of Service Details page.
This page breaks down as follows:
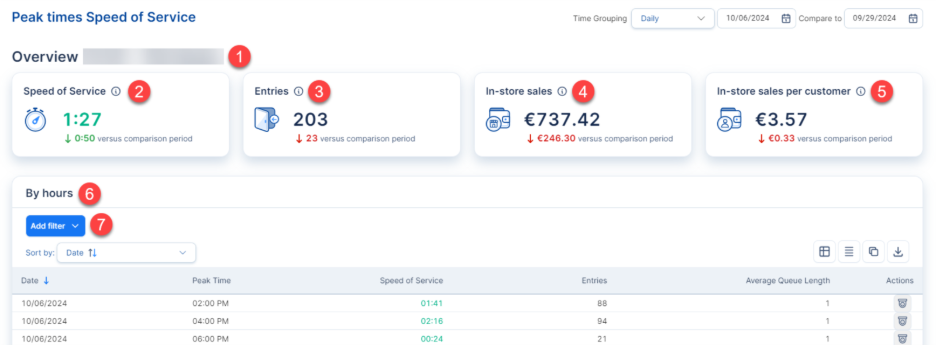
- Location Name: Next to the Overview header, you will see the name of your chosen Location.
- Speed of Service: Below the Location Name is the average Speed of Service for the current period in minutes and seconds.
- Entries: This number shows the total number of Entries that occurred in each period as compared to the previous period. An increase in Entries will be green with an up arrow, while a decrease will be red with a down arrow.
- In-store sales: This figure illustrates the total value of In-store sales that occurred in each period as compared to the previous period.
- In-store sales per customer: The last widget showcases the average value of in-store sales per entry in each period as compared to the previous period.
- Breakdown By hours: Beneath the widgets at the top of the page, you can view a comprehensive breakdown of Peak Time Speed of Service By Hours.
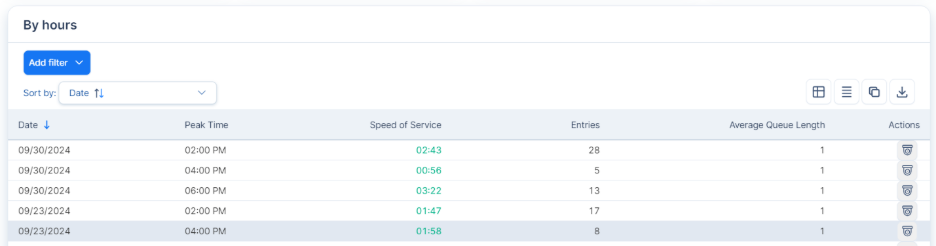
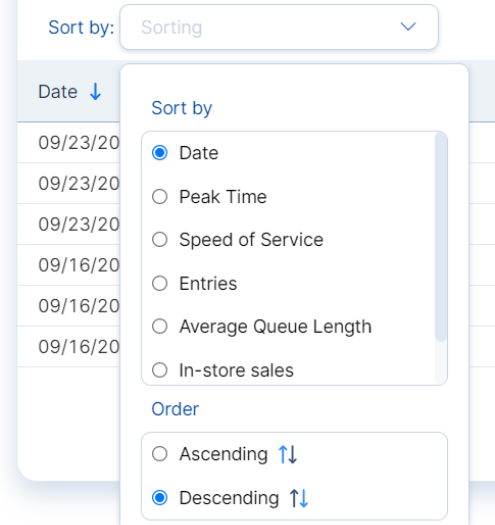
By default, the table is sorted by Date. Click the dropdown in the Sort by menu to change the sorting method.

In the table below, you can view more information for each Date and Peak Time, including Speed of Service, Entries, and Average Queue Length.
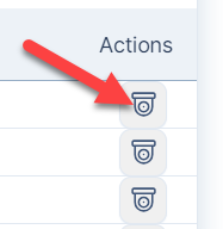
Under the Actions column, click the camera icon to view video footage of the specified Peak Time.
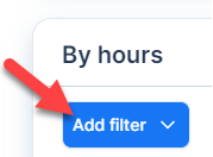
- Add filter: Here, you can add/remove filters to change the table view. To add a filter:
- Click the blue Add filter button.
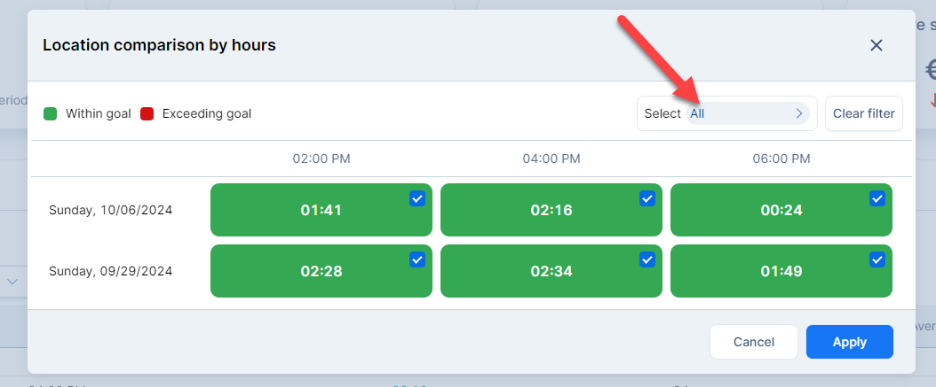
A menu will pop up. In the Location comparison by hours window, you will see times in green for times Within goal and in red for times Exceeding goal. To change your filters, click All next to Select at the top of the page.
Another menu will pop up. Tweak your settings as desired, then click Apply to save your changes.
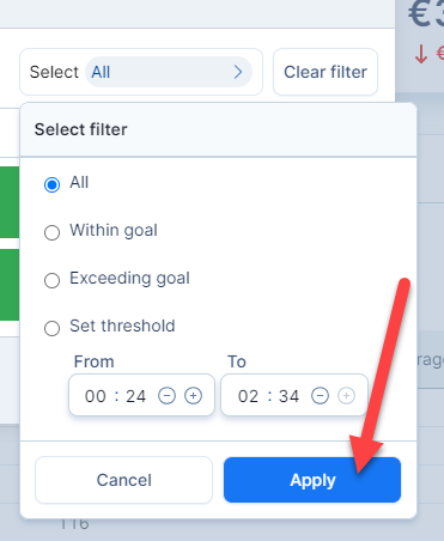
Click Apply again to apply your new filters to the table.

For additional information or questions, please contact DTiQ Support at support@dtiq.com or your Customer Experience Team at csr@dtiq.com.