360iQ’s RushReady AI helps you address operational efficiencies by optimizing the allocation of staff and the guest experience. You can tailor alerts and notifications for specific scenarios, helping you influence future outcomes.
Content
In this guide, we will cover the proceeding topics:
RushReady AI Workflow
In RushReady AI, the workflow behaves as follows:
- Summary
- Location list
- Scenarios list
- Selected scenarios
- Create new configuration
- Configuration details (camera, zones, duration, etc.)
- Notification schedule
- Recipients
- Summary
- Created configuration details
- Edit previously created configuration
- Snooze settings
- Create new configuration
How to Navigate to RushReady AI
To start using RushReady AI, proceed as follows:
- Log in to 360iQ: https://app.go360iq.com.
- From the Home screen or Quick bar, click the Video Analytics tile.
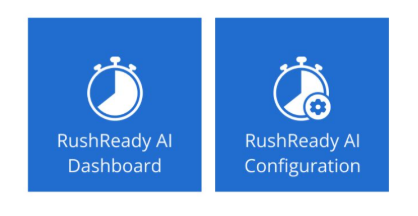
- Click the RushReady AI Configuration tile.
RushReady AI Scenarios
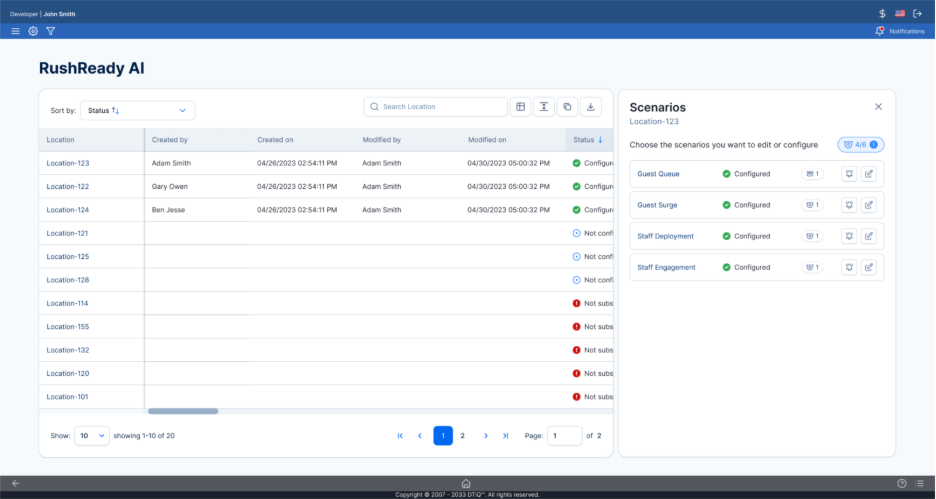
You will see the Location Overview Table. Here, you can view all your Locations and all created Scenarios.
Note: You can set up more than one alert/instance for each scenario.
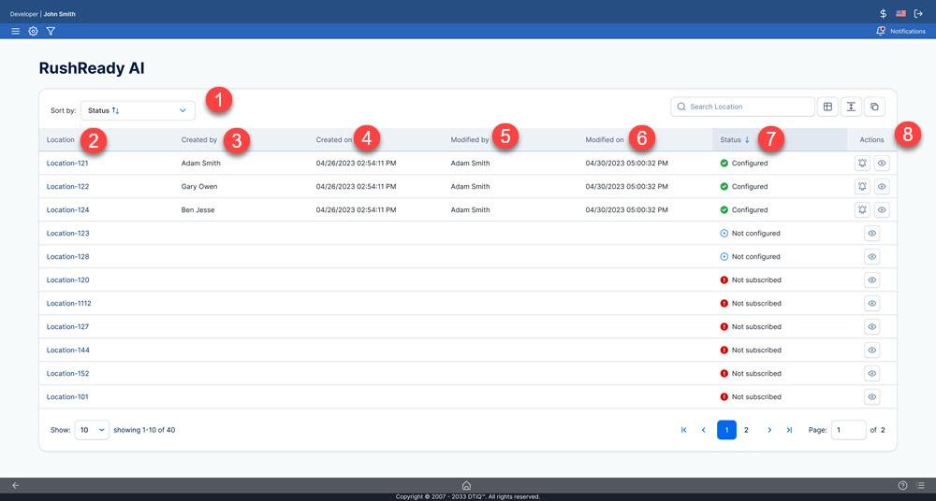
The table breaks down as follows:
- Sort by: Use the dropdown to easily sort the table by Status.
- Location: List of all locations that you have permission to see.
- Created by: The user who created the configuration.
- Created on: The date on which the configuration was created.
- Modified by: The user who most recently modified the configuration.
- Modified on: The date on which the configuration was most recently modified.
- Status: The configuration status for each location.
- Available statuses:
- Configured: When at least one scenario has been configured for a location.
- Not configured: When no scenario has been configured for a location.
- Not subscribed: When the location has not subscribed to RushReady AI, please contact your Account Executive or salesleads@dtiq.com.
- Available statuses:
- Actions: Mute all notifications (bell icon) for a particular location and for all configured scenarios. Click the eye icon to see the details of a location’s scenario and create/edit them as you desire.
- Notes:
- In the Scenarios panel, you can also see which type of camera (e.g., fisheye, dome, or standard) is used for each scenario.
- You can mute notifications for each scenario individually.
- Notes:
To start using RushReady AI, you will need to configure the settings for each location, as well as any desired scenarios at that location, including Guest Queue, Guest Surge, Staff Engagement, and Staff Deployment.
Note: There is a maximum limit of 6 cameras that can be configured across all scenarios.
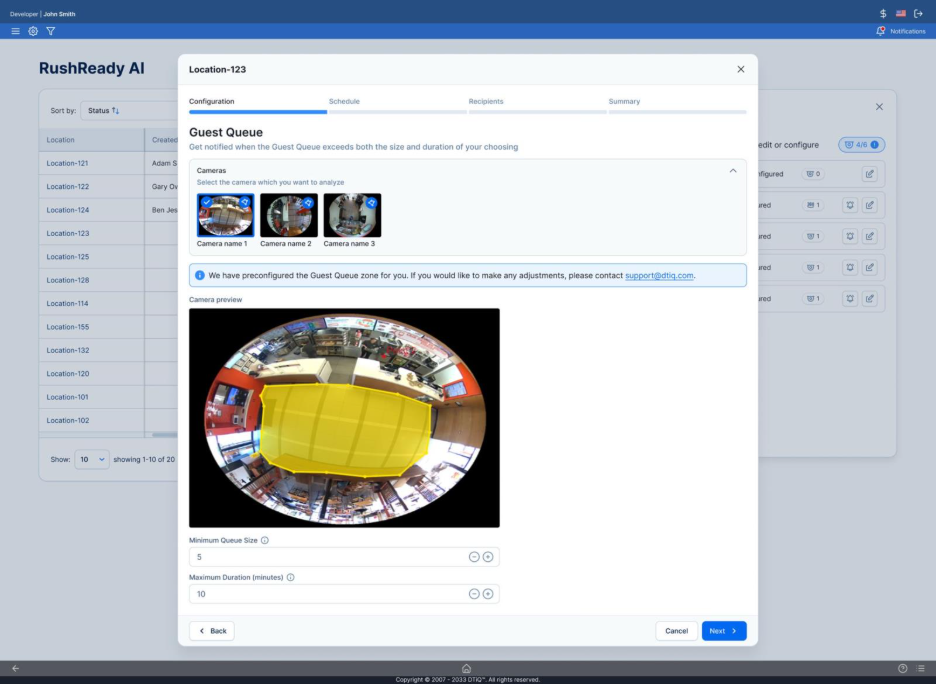
Guest Queue
In a Guest Queue scenario, you will be notified when a certain number of guests waiting in line exceeds a specific timeframe. This feature improves guest queue management by alerting you when the queue exceeds your predefined size and duration thresholds (e.g., “notify me when there are at least 6 people waiting in the queue for longer than 3 minutes). It empowers you to take proactive measures and address potential delays before they can escalate, ensuring a more positive guest experience.
Note: To configure the Guest Queue, there must be a fisheye camera above the customer queue.
To configure your Guest Queue settings, take these steps:
- Open the scenario panel for your location by clicking the eye icon in the Actions column.
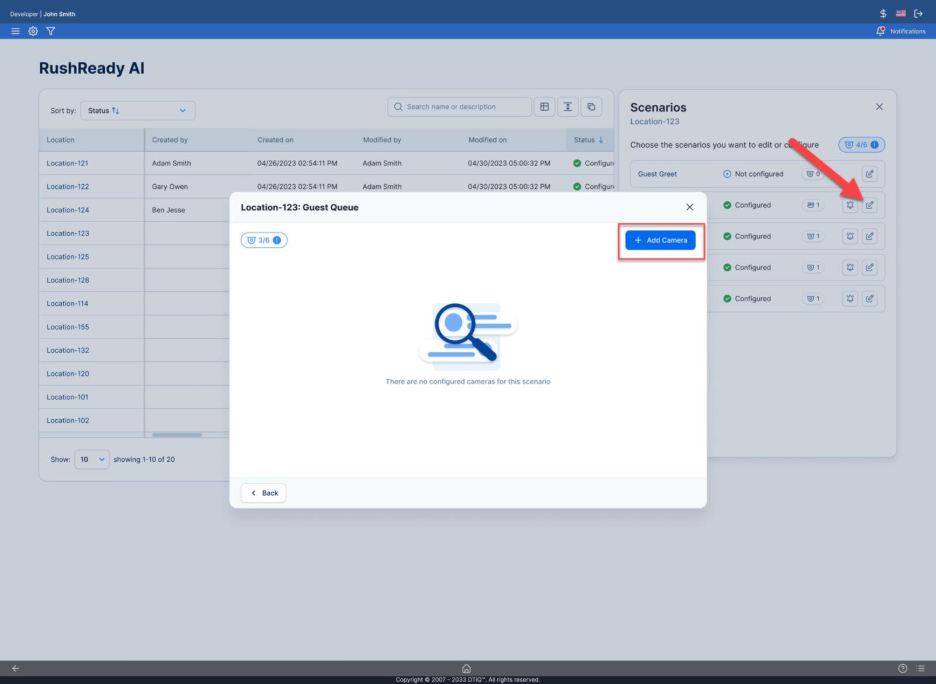
- In the Scenarios panel, click the edit (pen) icon next to Guest Queue.
- A menu will pop up. By default, unless previously configured, you will see the text There are no configured cameras for this scenario. In the top left, you will see the number of cameras that have been configured for all locations (out of 6 total cameras). Click the + Add Camera button.
- In the camera preview panel, the zones will not be visible in the thumbnails. To enlarge the camera preview, hover over the thumbnail.
- Note: By default, 360iQ will automatically configure zones for you. To adjust these zones, please contact Support.
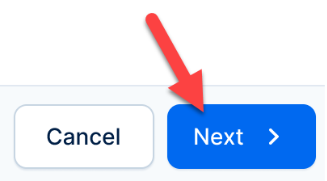
- Adjust the Minimum Queue Size and the Maximum Duration (minutes) using the + (plus) and – (minus) buttons. Note: The Minimum Queue Sizes must be greater than 0, and the Maximum Duration (minutes) must be greater than 0. Once both parameters have been configured, click Next.
- The Minimum Queue Size refers to the minimum number of guests that should be detected before a notification is sent. We recommend < 10 guests.
- The Maximum Duration refers to the duration of time in which guests must be present before a notification is triggered. We recommend up to 15 minutes.
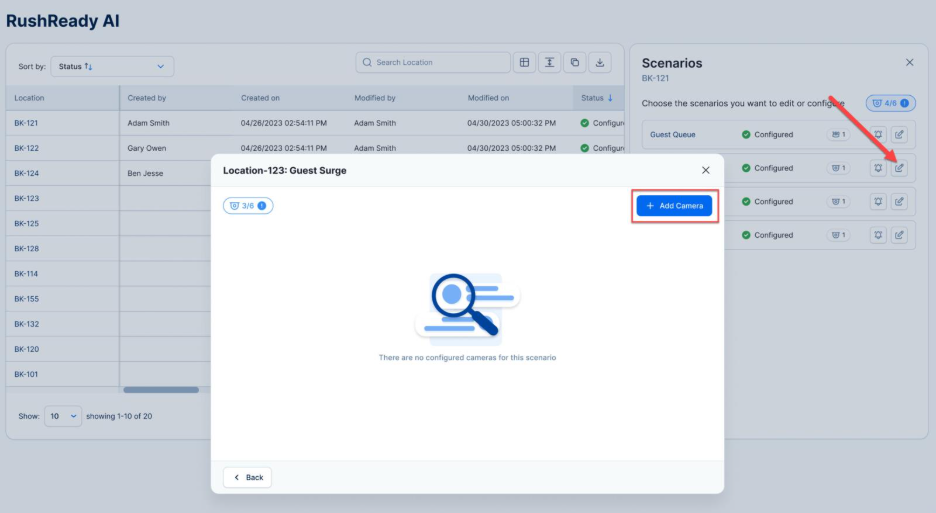
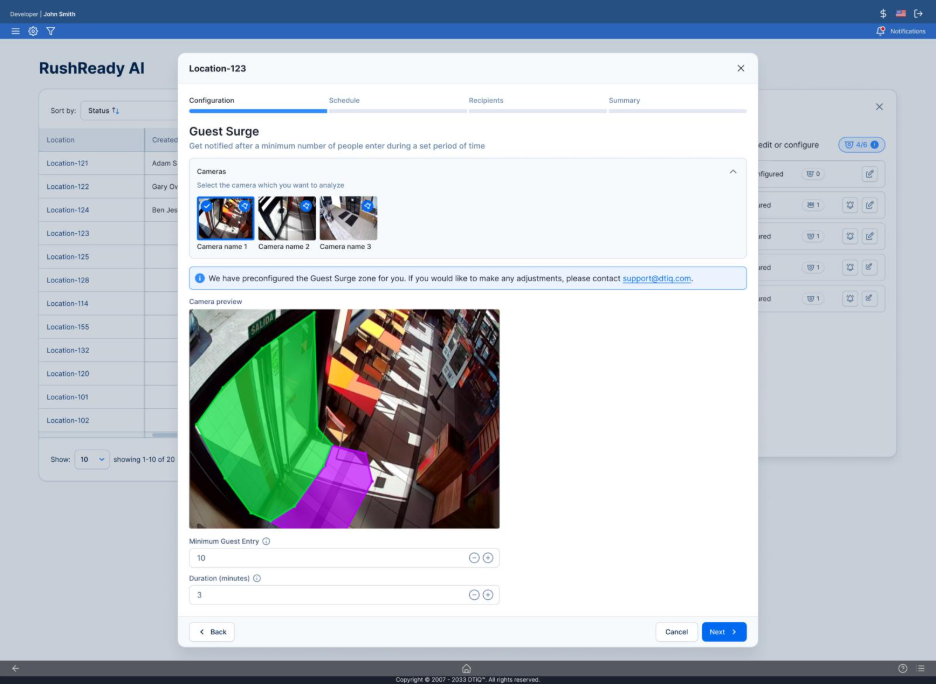
Guest Surge
By configuring a Guest Surge scenario, you can enhance guest flow management by tracking when a minimum number of guests enters the venue within a specified timeframe (e.g., “notify me when at least 10 people enter my location within 3 minutes).
To configure your Guest Surge scenario, take these steps:
- Open the scenario panel for your location by clicking the eye icon in the Actions column.
- In the Scenarios panel, click the edit (pen) icon next to Guest Surge.
- A menu will pop up. By default, unless previously configured, you will see the text There are no configured cameras for this scenario. In the top left, you will see the number of cameras that have been configured for this location (out of 6 total cameras). Click the + Add Camera button.
- You will see a Camera preview showing the preconfigured zone. In the camera preview panel, the zones will not be visible in the thumbnails. To enlarge the camera preview, hover over the thumbnail.
- Note: By default, 360iQ will automatically configure zones for you. To adjust these zones, please contact Support.
- Adjust the Minimum Guest Entry and the Duration (minutes) using the + (plus) and – (minus) buttons. Note: The Minimum Guest Entry must be greater than 0 people, and the Duration (minutes) must be greater than 0. Once these values have been configured, click Next.
- The Minimum Guest Entry refers to the number of guests that need to enter before a notification is triggered. We recommend > 4 guests.
- The Duration refers to the period of time in which guest entry count is measured. We recommend 4-15 minutes.
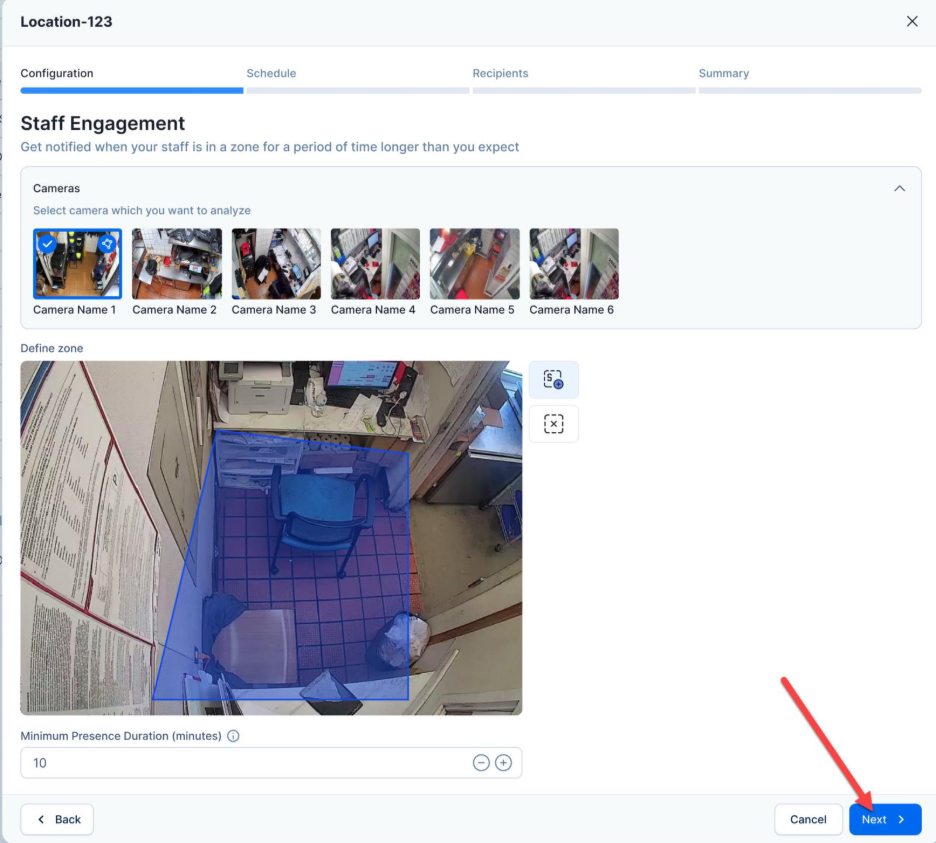
Staff Engagement
Setting up a Staff Engagement scenario improves staff management by highlighting when employees are in a zone longer than expected. This feature empowers you to take real-time actions to optimize resource allocation, ensuring smooth operations (e.g., “notify me when an employee stays in the back office for longer than 7 minutes”).
To configure your Staff Engagement settings, proceed as follows:
- Open the scenario panel for your location by clicking the eye icon in the Actions column.
- In the Scenarios panel, click the edit (pen) icon next to Staff Engagement.
- A menu will pop up. By default, unless previously configured, you will see the text There are no configured cameras for this scenario. In the top left, you will see the number of cameras that have been configured for this location (out of 6 total cameras). To change this, click the + Add Camera button.
- Select the cameras you want to analyze at this location and configure the zone by following the “Drawing Zones” instructions below.
- Adjust the Minimum Presence Duration (minutes) using the + (plus) and – (minus) buttons. Note: The Minimum Presence Duration (minutes) must be > 0 seconds.
- The Minimum Presence Duration refers to the time during which staff must be present before a notification is sent. We recommend > 10 minutes.
Drawing Zones
To access the drawing zone widget, follow this process:
- Select the camera for which you want to define a zone.
- To configure the zone, click the plus sign icon.
- Use your mouse to draw the zone directly in the camera view.
- To delete or redraw the zone, click the x icon.
Back Office
If covering the Back Office, consider the following:
- The zone should cover the entire room or total area in which we want to monitor employee presence.
- Draw around or avoid high-traffic areas, such as corridors or walkways.
- Draw the zone halfway up the wall and overlap the desk as in the example below.
Examples of correct zones:
Examples of incorrect drawn zones:
- The zone should be as simple as possible.
Storage Room
If covering a Storage Room, consider the following:
- The zone should cover the whole space in which people can move. It should also cover a few static objects, such as shelves, but can include temporary objects like boxes or pallets.
- The zone should exclude the corridor beyond the room (only the part at the entrance to the room). This zone’s height should be halfway up the wall.
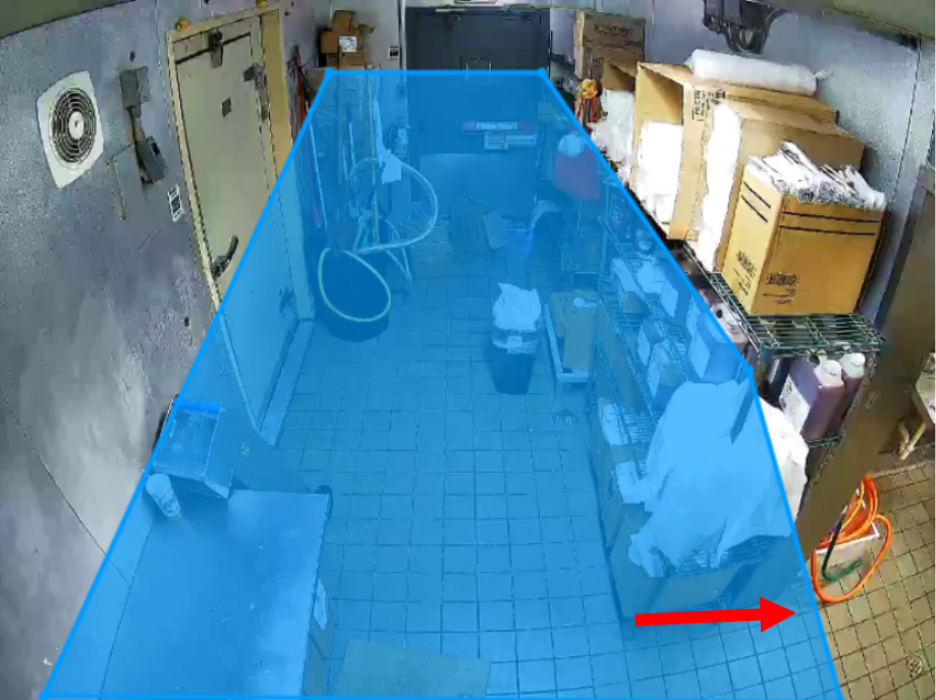
- The zone should include as few shelves (permanent elements) as possible. This zone should be halfway up the shelves.
Once you have configured your zones correctly, click Next.
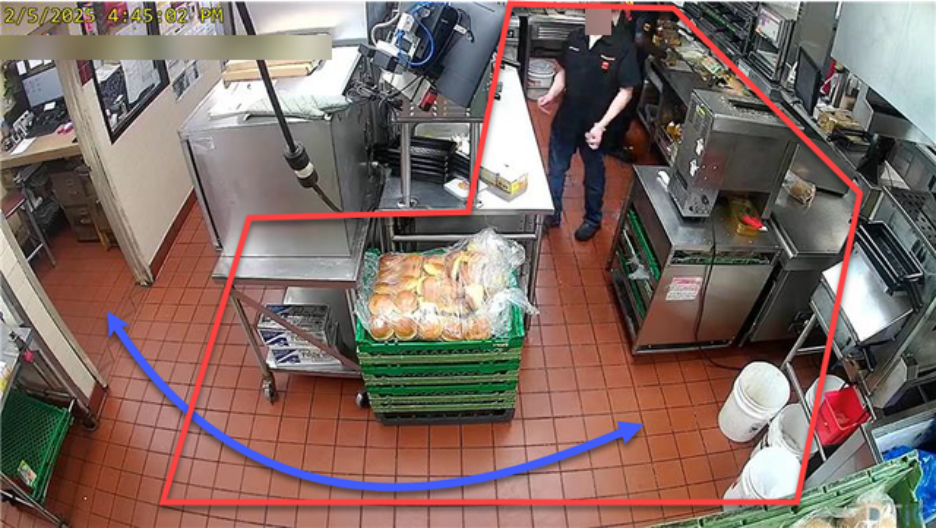
Staff Deployment
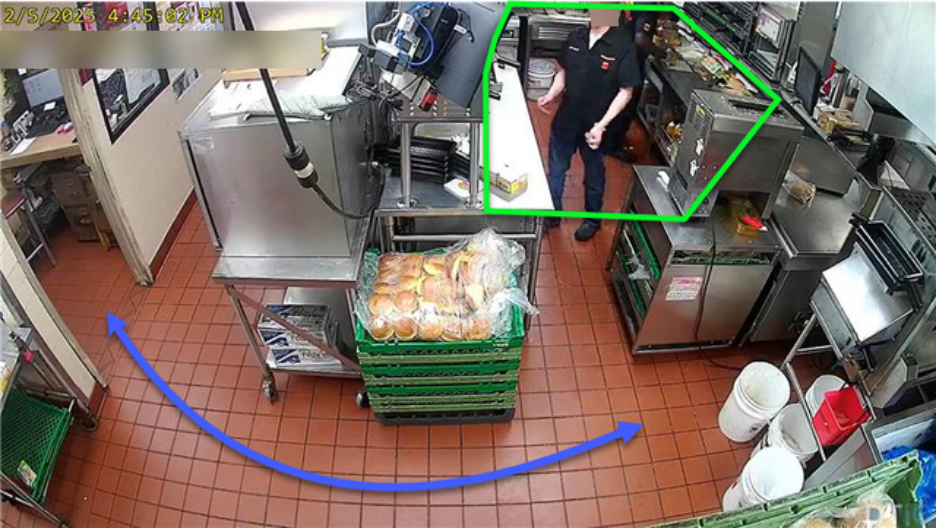
The Staff Deployment scenario enhances staff management by ensuring timely presence in business-critical zones. It highlights service gaps so you can address them quickly, streamlining operational efficiency and consistent service delivery during busy periods (e.g., “notify me when there is no employee at the food prep station for longer than 3 minutes”).
To configure your Staff Deployment settings, proceed as follows:
- Open the scenario panel for your location by clicking the eye icon in the Actions column.
- In the Scenarios panel, click the edit (pen) icon next to Staff Deployment.
- A menu will pop up. By default, unless previously configured, you will see the text There are no configured cameras for this scenario. In the top left, you will see the number of cameras that have been configured for this location (out of 6 total cameras). To change this, click the + Add Camera button.

- Select the cameras you want to analyze at this location. The first camera in the row is the default camera. You will see a Camera preview showing the configured zone. In the camera preview panel, the zones will not be visible in the thumbnails. To enlarge the camera preview, hover over the thumbnail.
- Adjust the Minimum Absence Duration (minutes) using the + (plus) and – (minus) buttons. Note: The Minimum Absence Duration (minutes) must be greater than 0 minutes. Once this value has been configured, click Next.
- The Minimum Absence Duration refers to the amount of time that must pass without people present before a notification is triggered. We recommend > 8 minutes.
Drawing Zones
Preparation Station Absence
When drawing zones for Preparation Station Absence, consider the following:
- The zones for Staff Deployment should cover the food preparation or dishwashing area. This is the area in which you will be detecting employee presence.
- The entire event must be included in the zone.
- The zone size should cover your desired area yet be as small as possible.
Example of correct zone:

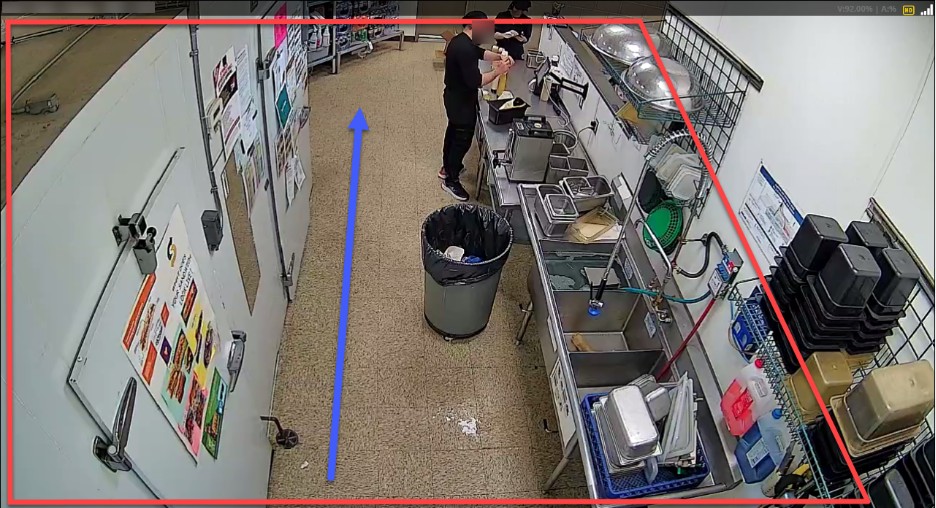
Example of incorrect zone (whole camera view inside the zone):
Example of incorrect zone (man mostly outside zone):
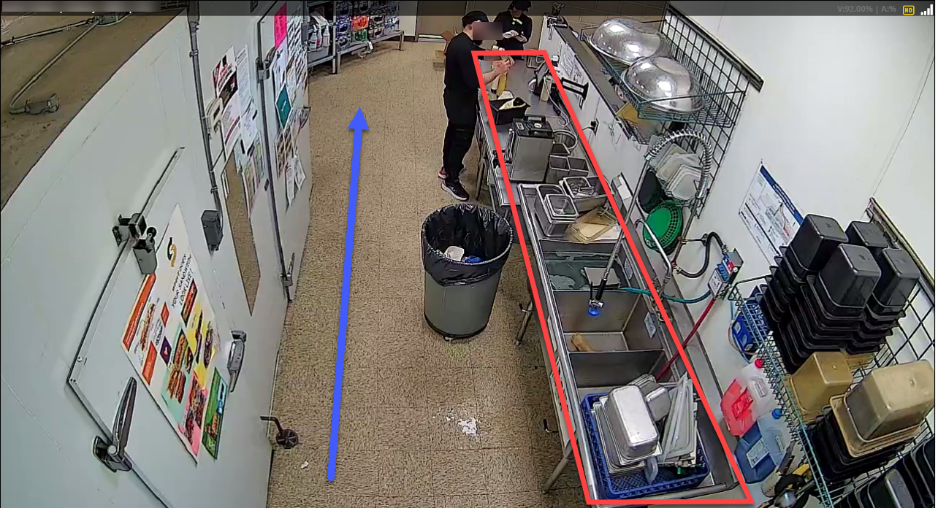
- The edge of the drawing zone should be as simple as possible. Also, make sure the edges do not cross.
Examples of correct zones:


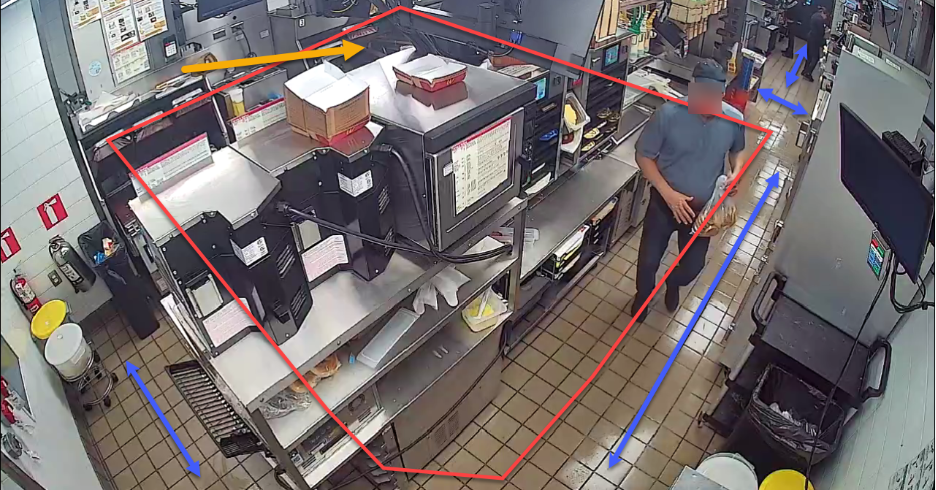
- Zones should not contain traffic corridors. Traffic corridors encompass any areas through which employees may pass.
Example of correct zone:
Example of incorrect zone (whole traffic corridor inside zone):
- Zones should be limited to areas in which people can be detected. They should not include any spaces in which people cannot be found.
Example of correct zone:

Example of incorrect zone (people cannot be detected):
- Zones should not contain objects that could trigger false positives. These objects include coats, hangers, boxes, etc.
- Once your zone has been properly configured, click the Next button.
Universal Scenario Parameters
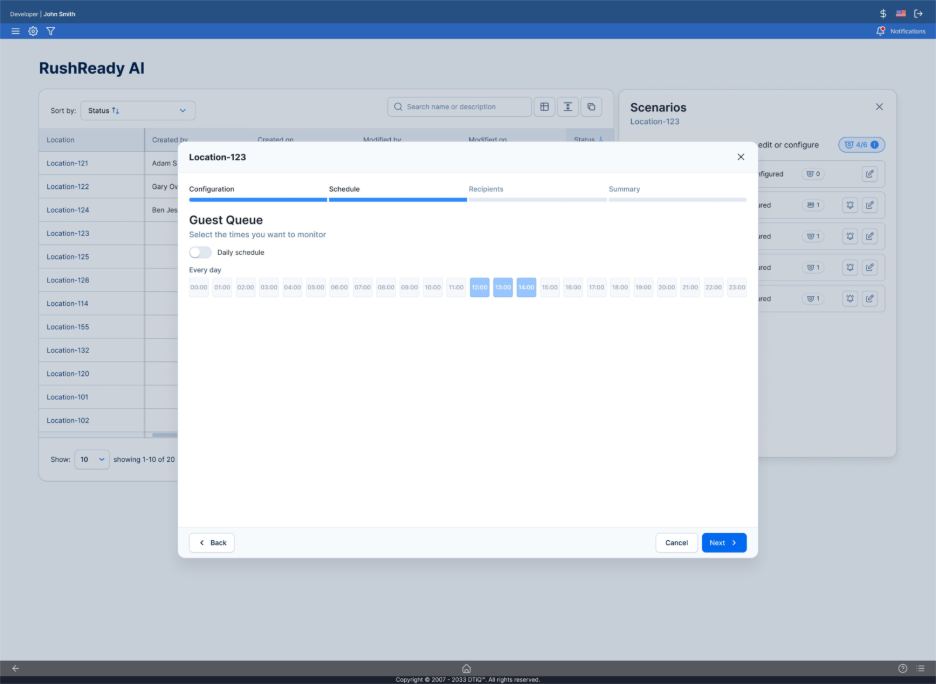
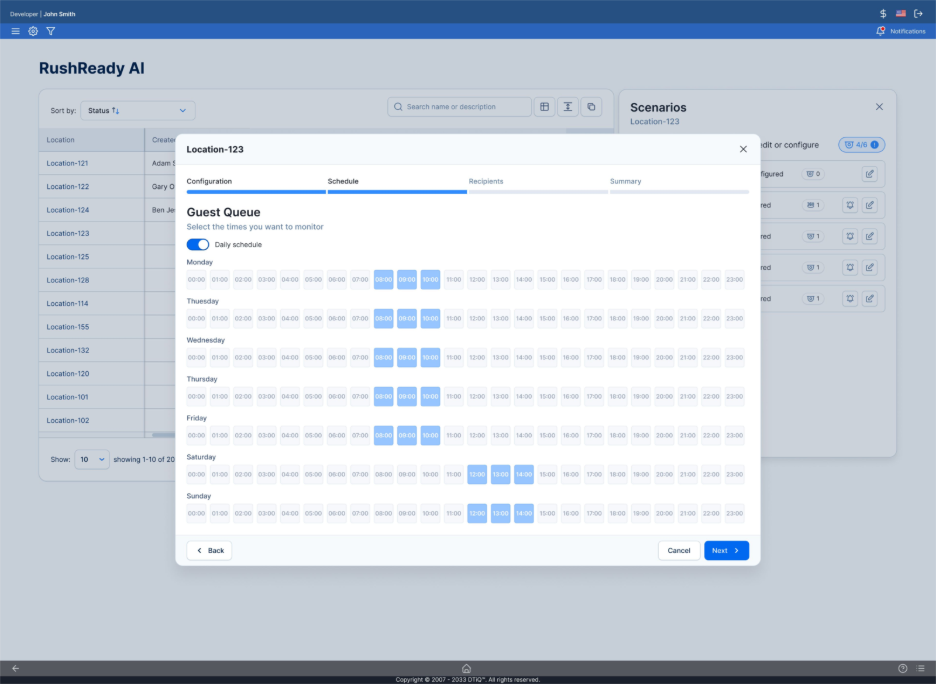
For all scenarios, the Schedule, Recipients, and Summary sections will be the same. As you come to these sections, follow this procedure:
- Configure the scenario Schedule. Select the times you want to monitor.
- Note: By default, the monitoring times are set to recur each day. To select various times for different days, flip the Daily schedule toggle. You can select as many slots as you like, so long as they are consecutive. Click Next.

- Then, select the alert Recipients and notification types (Text message, Push notification, and Email notification. You must select at least one recipient and at least one type of notification to proceed. Click Next.
- Note: If the user does not have a validated phone number, the text “not configured number” will be displayed. To configure a number, go to the User Management Settings.
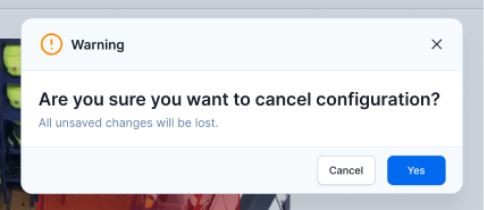
- Review the Summary, including Cameras, Camera Name, Alert Conditions, Schedule, and Recipients (Name, Email address, Phone number, Text message, Push notification, and Email notification). Make changes as needed by clicking the < Back button. Once you are satisfied with the configuration, click Save. To discard your configuration or changes, click Cancel.
- Note: You can cancel configuration at any step of the flow by clicking Cancel.

How to Edit Existing Scenarios
If there is a pre-existing RushReady AI scenario you would like to edit, take the following steps:
- Navigate to RushReady AI.
- On the overview page, find the location of the scenario you want to edit. Click the eye icon under the Actions column to view more details of the configuration.
- The Scenarios panel will pop up. Find the scenario you want to edit, then click the edit (pen) icon.
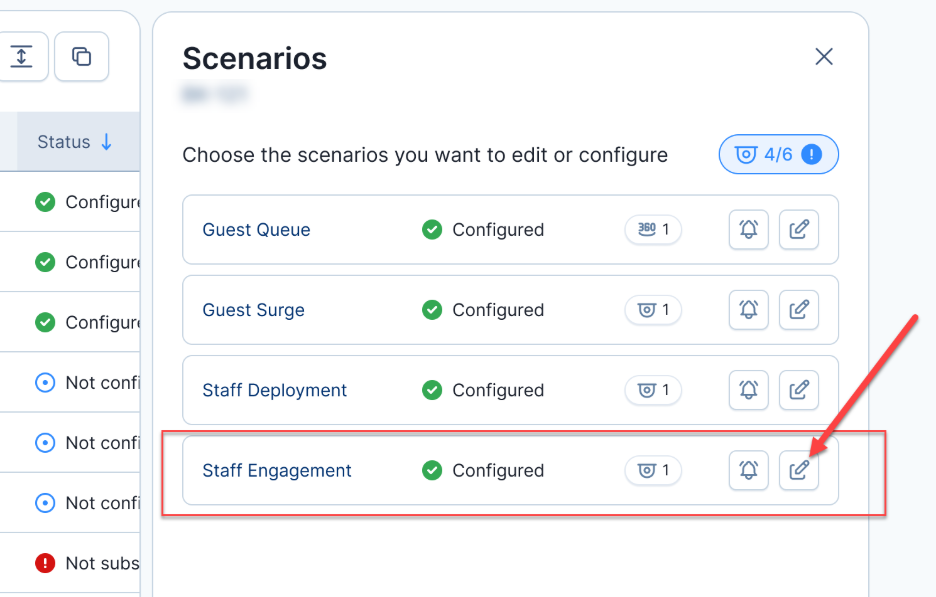
- The Configuration wizard will open. Change your desired parameters for drawing zones, then click Next.
- Note: You can cancel and discard your changes at any point in the process by clicking Cancel.
- Review your Schedule, Recipients, and Summary, then click Save to complete the process.
RushReady AI Dashboard
The RushReady AI Dashboard provides comprehensive insights into notifications sent across various scenarios and locations. You can use it to monitor notification distribution, analyze patterns over time, and evaluate scenario-specific trends through intuitive visualizations and detailed breakdowns. The dashboard enables you to identify trends across various times and comparison quickly in an easily digestible traffic-light grid.
Accessing the Dashboard
To access the RushReady AI Dashboard, follow these steps:
- Log in to 360iQ: https://app.go360iq.com/.
- From the Home Screen or Quick bar, find the Video Analytics tile, and click it.
- You will then be redirected to the RushReady AI Dashboard.
Organization View
The organization view of the Dashboard allows you to track how many aggregated notifications have been generated for each location across all configured scenarios. This helps you monitor activity trends, analyze patterns, and compare locations to identify any that need special attention.
The aggregated data represents notifications sent for each unique scenario during the scheduled period. The default period is 7 days and can be changed to a 30-day or user-defined period. Note: Even when multiple notifications are generated for a single scenario at a particular hour, they will be counted as 1.
Use the Custom Date Picker in the top right-hand corner of the screen to select which period you want to analyze.
Options for changing the table’s display are the following:
- Sorting: Easily sort the table based on location.
- Searching: Easily search for a location.
- Exporting: Easily export the table for sharing.
- Other table features: Change row spacing or copy or export the table.
Location View
To switch from organization view to location view, click the eye icon under the Actions column.
The Dashboard’s location view provides a detailed breakdown of the percentage of notifications sent for each scenario at specific time intervals, enabling you to monitor and understand notification patterns within scheduled timeframes. It displays the percentage proportion of notifications sent for each unique scenario hourly (when configured) via this color coding:
- Green: 0%
- Yellow: 20-60%
- Red: 80-100%
Note: When no scenario is configured, 0% is displayed.
You can edit your view with filters (filter by each type of scenario) or data grouping (group and analyze data over weekly or monthly periods).
Hover over a color-coded cell to view the exact number of triggered notifications sent for each scenario at a specific hour.
Comparison View
To switch from location view to comparison view, navigate to the date box and select the date range that you want to compare.
The comparison view provides a weekly/monthly breakdown of changes in notification percentages for each scenario. This lets you track trends and variations over time, offering a clearer perspective on how scenario distributions evolve across weeks. The color coding is the same as in the location view.
Next to the percentage displayed as on location view, another percentage number reflects the change compared to the number of notifications at the same time last week. Beside that percentage change, a red up arrow symbolizes an increase, whereas a green down arrow symbolizes a decrease. If there has not been any change, neither percentage change value nor arrow will be displayed.
Hover over one of the color-coded cells to view the exact number of notifications sent for each scenario at a specific hour.
For additional information or questions, please contact Support at support@dtiq.com or your Customer Experience Team at csr@dtiq.com.